Global Business Development Status Graph – Vision for Expansion
RJ0300074_20
- Last Update 05/09/2025
- File Size 0.2MB
- # of Slides 2
- File Format PPTX
- Slide Ratio 16:9
- Color
Keywords
- #Content-Based Slides
- #Design-Based Slides
- #Product/Service Introduction
- #Business Introduction
- #Graph
- #Development Status
- #Technological Status
- #Horizontal Bar
- #Segmented Horizontal Bar
- #16:9
- #horizontal bar chart PowerPoint
- #comparison analysis slide template
- #business development presentation
- #dual-bar chart template
- #global business slides
- #how to create bar chart in PowerPoint
About the Product
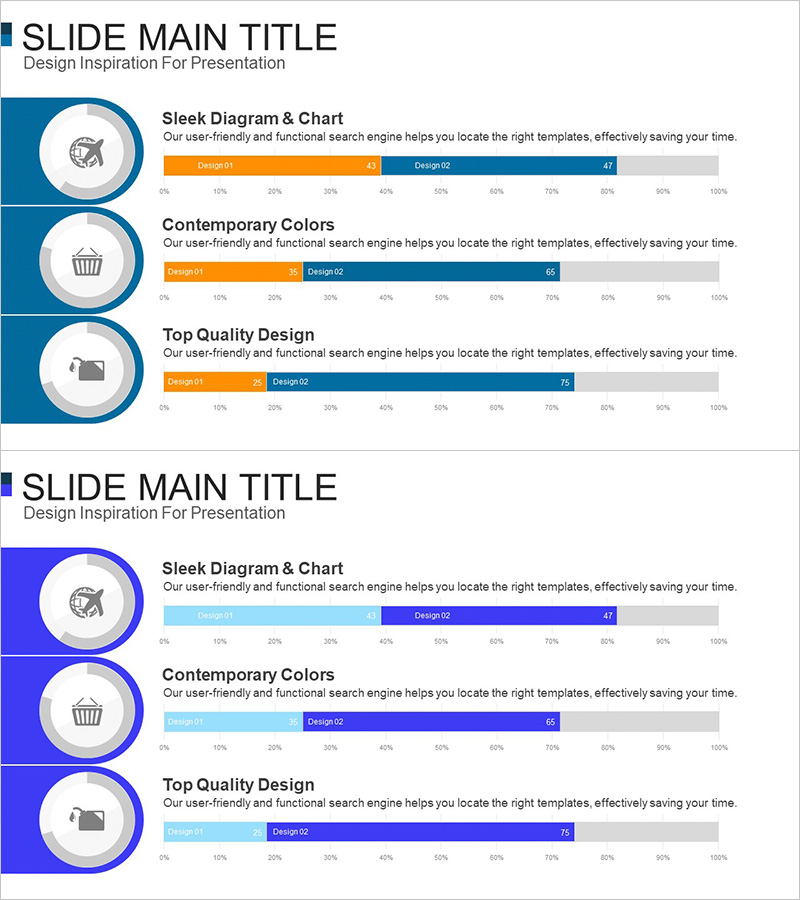
A 2-slide horizontal bar chart PowerPoint presentation for visualizing global business development status. Features dark blue circular icons on the left and dual-color bar charts (orange and dark blue) comparing two design scenarios (Design1 and Design2). The 0–100% horizontal scale enables intuitive comparison of quantitative metrics such as performance indicators, expansion targets, and market share. Delivered in 16:9 widescreen PPTX format, fully editable and ready for business status presentations, strategic planning meetings, and investor pitch decks.
Usage Points
-
Main Usage
Visualizes business development status, strategic planning, and performance comparison using quantitative data. The side-by-side bar layout clearly presents decision-making evidence, making it ideal for global expansion strategies, market entry plans, and investment impact analysis presentations.
-
How to Use
Replace chart values with actual data. Orange bars represent current performance or existing design scenarios; dark blue bars represent targets or new design proposals. Edit the circular icon labels on the left to add category names or department titles for context.
-
Recommended For
Recommended for business development teams, strategic planning departments, and executive reporting. Particularly effective for quarterly performance reviews, new business proposals, global expansion presentations, and investor relations materials requiring clear numerical comparisons.
-
Slide Structure
2-slide layout. Each slide features three dark blue circular icons (gear, shopping cart, briefcase) on the left, with dual horizontal bars (orange and dark blue) on the right showing 0–100% scale and numerical labels. Gray area at bottom provides space for additional information.
Related Products
-

Data Analysis Segmented Bar Graph – Technology Status and Analysis
#Product/Service Introduction #Business Introduction #Graph
-

Business Analysis with Doughnut Chart – Dawn City Theme
#Product/Service Introduction #Business Introduction #Diagram
-

Visualizing Current Internet Shopping Payment Technologies with Horizontal Bar Graph
#Business Introduction #Market and Competitor Analysis #Graph
-

User Analysis Status by Year – Growth and Change
#Product/Service Introduction #Market and Competitor Analysis #Graph
