Blue Green Stacked Bar Chart – Market Trend Analysis
RJ0900003_17
- Last Update 08/16/2025
- File Size 0.1MB
- # of Slides 2
- File Format PPTX
- Slide Ratio 16:9
- Color
Keywords
- #Content-Based Slides
- #Design-Based Slides
- #Business Introduction
- #Market and Competitor Analysis
- #Graph
- #Industry Trends
- #Horizontal Bar
- #Segmented Horizontal Bar
- #16:9
- #100% stacked bar chart PowerPoint
- #stacked bar graph template
- #market analysis slide
- #horizontal bar chart presentation
- #year-over-year data comparison
- #competitive analysis chart PowerPoint
About the Product
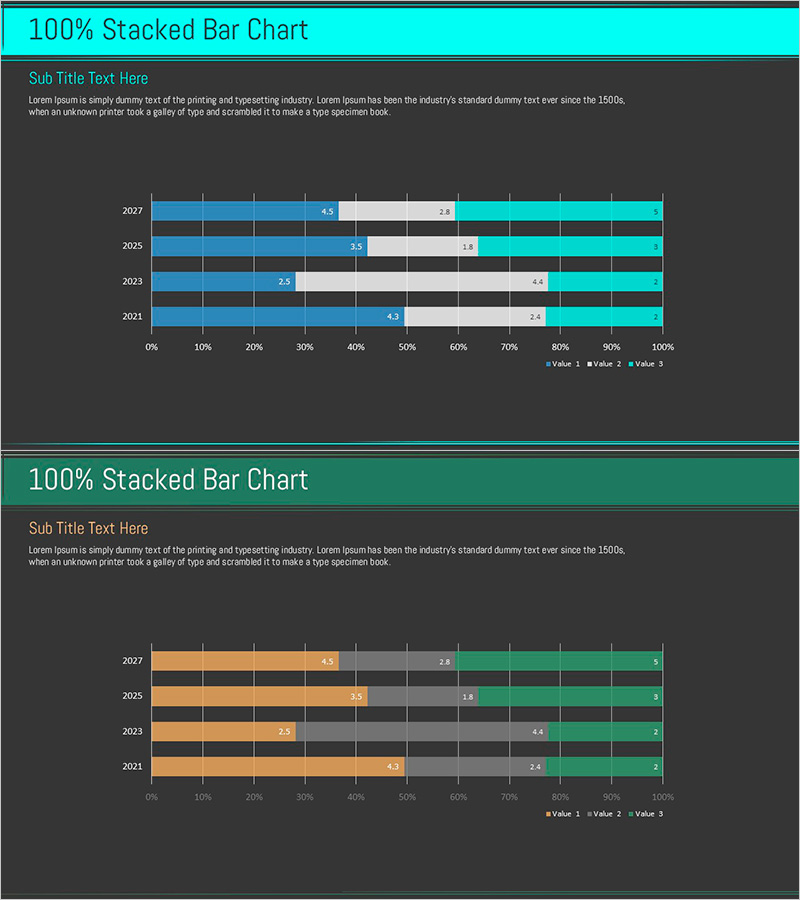
A fully editable 100% stacked bar chart PowerPoint slide designed for market analysis and competitive benchmarking presentations. This slide visualizes data across four years (2021–2027) with three distinct data series, each clearly labeled with numerical values. The color scheme uses cyan, orange, and green to differentiate series, ensuring strong contrast against the dark background for maximum presentation impact. The 16:9 widescreen format includes two slides with clearly separated title and chart areas, ready for immediate use in business presentations. Ideal for business overviews, market trend analysis, performance reports, and competitive positioning discussions.
Usage Points
-
Main Usage
Simultaneously displays both the composition ratio and absolute values of multi-series data across time periods. Effectively communicates market share evolution, revenue composition, customer segmentation changes, and other metrics where both relative proportions and absolute trends matter to the audience.
-
How to Use
Apply this slide in market analysis sections of business plans, quarterly or annual performance reports, competitive benchmarking documents, and investor pitch decks when explaining market size evolution and share trends. Simply replace the data values to convert the template to your actual figures.
-
Recommended For
Marketing professionals, business strategists, financial analysts, and executives presenting market conditions and business performance metrics. Particularly valuable when comparing multiple data series or emphasizing compositional shifts over time to stakeholders.
-
Slide Structure
Each slide features a cyan header area for titles and a dark background chart zone. The 100% stacked bar chart displays four years (2021, 2023, 2025, 2027) with three stacked segments per year, scaled from 0–100%. Numerical labels appear on each segment, with a clear legend and axis labels for easy interpretation.
Related Products
-

Yearly Breakdown of Sales Trends – Visualizing Market Dynamics
#Business Introduction #Market and Competitor Analysis #Graph
-

Market Research and Trend Segmentation Chart – Effective Market Analysis
#Business Introduction #Market and Competitor Analysis #Graph
-

Graphic Analysis of Safety Accidents – Market Insights and Trends
#Business Introduction #Market and Competitor Analysis #Graph
-

Construction Progress Chart – Business Introduction and Market Analysis
#Business Introduction #Market and Competitor Analysis #Graph
