Donut Chart Comparing Market Share by Coffee Brand
RB0700028_4
- Last Update 03/16/2025
- File Size 1.6MB
- # of Slides 2
- File Format PPTX
- Slide Ratio 4:3
- Color
Keywords
- #Content-Based Slides
- #Design-Based Slides
- #Market and Competitor Analysis
- #Diagram
- #Graph
- #Market Share
- #Market Analysis
- #Cluster
- #Circles
- #Closed Cluster Diagram
- #Doughnut Chart
- #4:3
- #donut chart PowerPoint
- #pie chart slide template
- #market share comparison
- #donut graph design
- #ratio visualization
- #coffee brand analysis PowerPoint
About the Product
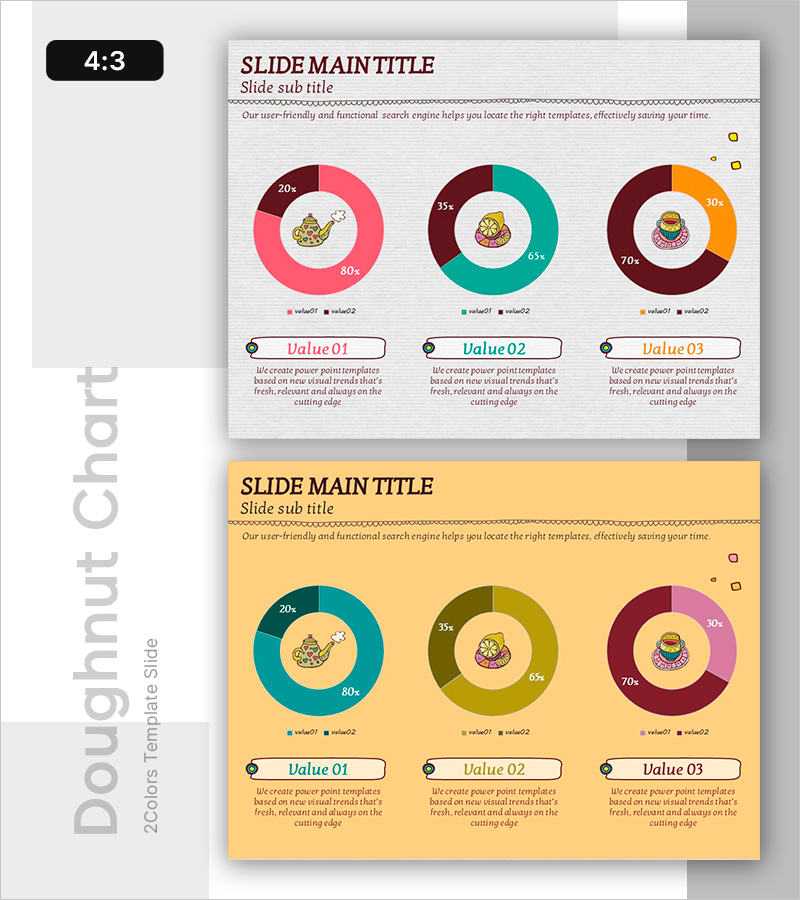
This PowerPoint slide features three donut charts comparing market share across coffee brands. The design uses vibrant pink, teal, and orange color palettes to visualize brand performance, with central icons that enhance data comprehension. The 2-slide template is ready for immediate use in market analysis presentations. Each donut chart displays two data series, enabling detailed ratio comparisons and competitive positioning analysis across brands.
Usage Points
-
Main Usage
Visualize market share, brand performance metrics, and competitive analysis using donut charts to enhance audience comprehension. Applicable across consumer goods, beverage, retail, and distribution industries for quantitative data presentation.
-
How to Use
Replace chart values and legends with your actual data. Customize central icons with product images or logos, and adjust colors to match brand guidelines. Insert directly into presentations, reports, and business proposals.
-
Recommended For
Ideal for marketing professionals, market analysts, sales executives, and management reporting. Perfect for competitive analysis, market positioning, investor pitches, business plans, and quarterly performance reviews.
-
Slide Structure
2-slide template with 3 donut charts arranged horizontally on each slide. Each donut includes a central icon, two data series with percentages, and a legend for clear comparative analysis.
Related Products
-

Donut Chart Slide for Dessert Menu Research – Market Analysis
#Market and Competitor Analysis #Diagram #Graph
-

Speed Timer Diagram for Market Share Analysis
#Market and Competitor Analysis #Diagram #Graph
-

Pie Chart of Shooting Status Analysis – Visual Insights
#Product/Service Introduction #Market and Competitor Analysis #Diagram
-

Travel Destination Infographic Market Share – Intuitive Data Visualization
#Market and Competitor Analysis #Graph #Market Share
