Global Business Growth Analysis Status Graph
RM0300021_7
- Last Update 02/13/2025
- File Size 0.3MB
- # of Slides 2
- File Format PPTX
- Slide Ratio 16:9
- Color
Keywords
- #Content-Based Slides
- #Design-Based Slides
- #Company Introduction
- #Market and Competitor Analysis
- #Diagram
- #Graph
- #Shareholder Structure
- #Market Analysis
- #Cluster
- #Circles
- #Closed Cluster Diagram
- #Doughnut Chart
- #16:9
- #donut chart PowerPoint
- #pie chart slide template
- #4-segment ratio graph
- #shareholder composition chart
- #business analysis presentation
- #global growth analysis slide
About the Product
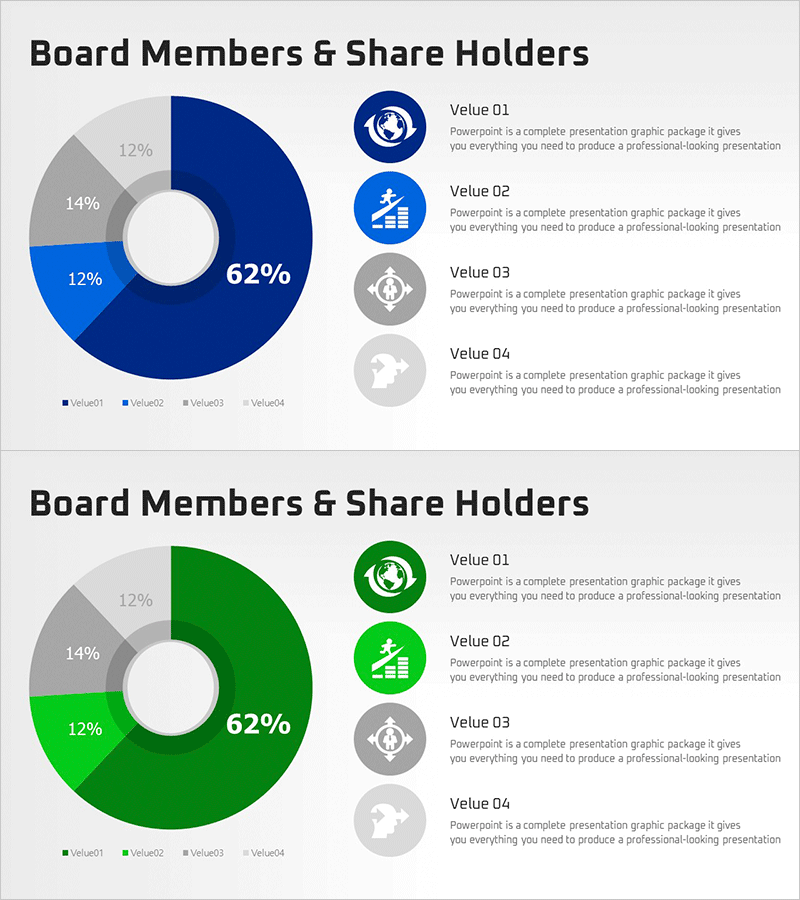
A donut-shaped pie chart PowerPoint slide designed to visualize global business growth analysis and shareholder composition. The slide features four color-coded segments (dark blue 62%, bright blue 12%, gray 14%, light gray 12%) arranged in a donut format with a hollow center, clearly displaying proportional relationships. The right side includes four circular icons with descriptive text labels for each value, enabling intuitive data communication. This 2-slide set (16:9 aspect ratio) is ready to use in company presentations, market analysis reports, and business performance sections.
Usage Points
-
Main Usage
Designed to present four-item proportional relationships such as global business growth status, shareholder composition, market share, and departmental budget allocation at a glance. The hollow center space can accommodate additional text or logo insertion, while clearly differentiated segment colors ensure excellent readability in both print and digital formats.
-
How to Use
Apply this slide in company presentation business status sections, investor briefing shareholder composition slides, and quarterly business report performance analysis pages. Edit each segment's color and proportion to match your data, and replace the right-side text labels with corresponding item names. The 2-slide format enables comparative analysis and visualization of changes over time.
-
Recommended For
Recommended for executives, CFOs, and finance professionals explaining shareholder structure and capital composition; marketing teams analyzing market share; and HR departments visualizing organizational structure. Ideal for consulting firms, financial institutions, and large corporations preparing periodic reports.
-
Slide Structure
Slide 1: Four-segment donut chart with dark blue (62%), bright blue (12%), gray (14%), and light gray (12%) sections. Four circular icons with 'Value 01–04' text labels positioned on the right. Slide 2: Identical structure with green color variant (dark green 62%, bright green 12%, gray 14%, light gray 12%) for color scheme flexibility.
Related Products
-

Status Analysis Thin Donut Chart - Visualizing Shareholder Status in PowerPoint
#Company Introduction #Market and Competitor Analysis #Diagram
-

Health Checkup Data Analysis Circular Graph – Effective Business Data Visualization
#Product/Service Introduction #Market and Competitor Analysis #Diagram
-

Shareholder Status Detailed Analysis Pie Chart & Table – Impactful Data Visualization
#Company Introduction #Market and Competitor Analysis #Diagram
-

Pie Chart of Shooting Status Analysis – Visual Insights
#Product/Service Introduction #Market and Competitor Analysis #Diagram
