Market Share Analysis vs Competitors – Data Visualization
RB0700018_5
- Last Update 03/16/2025
- File Size 0.7MB
- # of Slides 2
- File Format PPTX
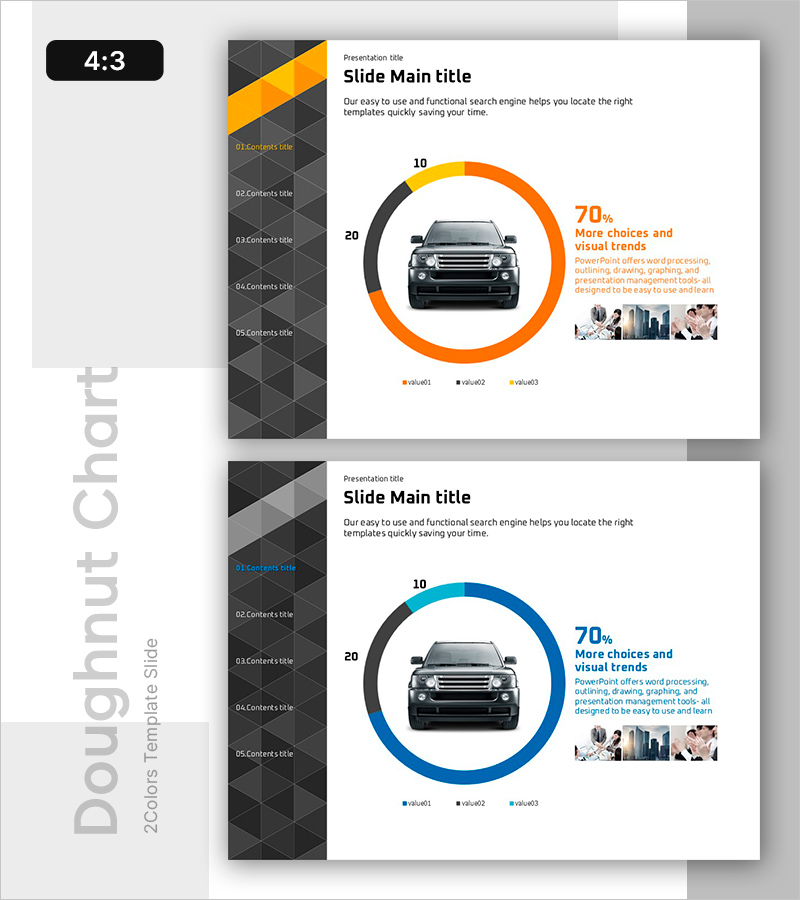
- Slide Ratio 4:3
- Color
Keywords
About the Product
A donut chart PowerPoint slide designed for market share and competitive analysis presentations. The layout features a central product image surrounded by three data series in a donut formation, enabling instant visual comparison of proportional relationships. The color scheme combines orange, black, and yellow for clear visual contrast, while the left navigation bar and dark gray geometric pattern background convey professionalism. This template is ready to use for business presentations, strategic reports, and competitive landscape analysis.
Usage Points
-
Main Usage
Ideal for visualizing market share, competitive positioning, and category-based proportional data with a central focal point. The donut structure maximizes the center space to highlight key product images or critical metrics alongside data representation.
-
How to Use
Add your table of contents to the left navigation bar, then replace the three data series with your actual figures. Insert your product image or company logo in the center area to establish context, and write your analysis findings and insights in the right text section.
-
Recommended For
Marketing professionals, strategy planners, sales presentations, executive reports, and market research analysis. Particularly effective for industries with clear competitive dynamics such as automotive, consumer goods, and technology sectors.
-
Slide Structure
2-slide set. Slide 1: Orange-black-yellow donut chart with central car image, 70% metric and descriptive text on right, legend at bottom. Slide 2: Identical layout with blue-series donut chart. 4:3 aspect ratio, PPTX format.
Related Products
-

Analyzing ABC District Occupancy with Doughnut Chart
#Market and Competitor Analysis #Graph #Other
-

Doughnut Chart for Market Share Analysis – Visualizing Data at a Glance
#Market and Competitor Analysis #Graph #Market Share
-

Donut Chart Slide for Dessert Menu Research – Market Analysis
#Market and Competitor Analysis #Diagram #Graph
-

Competition and Cooperation Donut Charts
#Market and Competitor Analysis #Graph #Market Share
