Donut Chart Slide for Dessert Menu Research – Market Analysis
RJ0800042_10
- Last Update 08/11/2025
- File Size 0.5MB
- # of Slides 2
- File Format PPTX
- Slide Ratio 16:9
- Color
Keywords
- #Content-Based Slides
- #Design-Based Slides
- #Market and Competitor Analysis
- #Diagram
- #Graph
- #Market Share
- #Market Analysis
- #Cluster
- #Circles
- #Closed Cluster Diagram
- #Doughnut Chart
- #16:9
- #donut chart PowerPoint slide
- #pie chart template
- #market analysis chart
- #proportion visualization
- #4-segment donut graph
- #market share PPT
About the Product
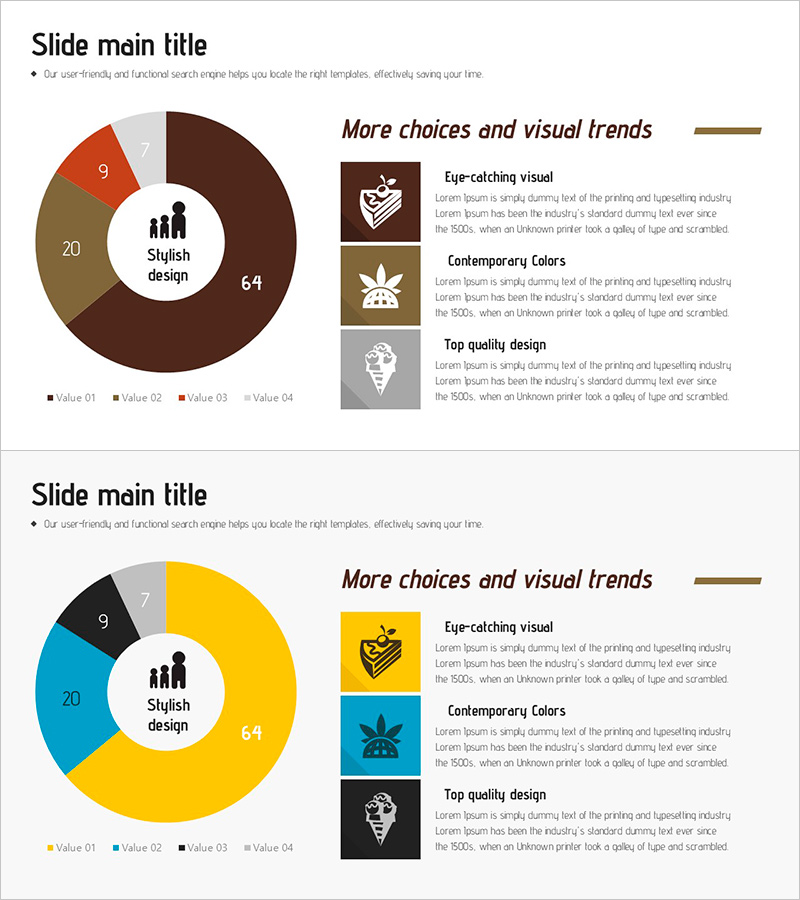
A donut chart PowerPoint slide designed for dessert menu market research and market share analysis. The donut graph features four color segments—brown, orange, blue, and gray—that intuitively represent the proportion of each category. The center icon and text emphasize key messages, while the 2-slide set demonstrates multiple data visualization approaches optimized for 16:9 widescreen format. Ready to use immediately in marketing plans, business reports, and market analysis presentations.
Usage Points
-
Main Usage
Visualizes market share, sales ratios, customer composition, and product category distribution as parts of a whole. The center area accommodates key metrics or icons to increase focus, while the four segments enable clear comparative analysis across categories.
-
How to Use
Apply to market analysis sections in marketing plans, sales performance reports in business documents, market size explanations in investor pitches, and customer demographic distribution in product presentations. Edit segment values with actual data, customize labels and titles to match your presentation context, and adjust colors as needed.
-
Recommended For
Marketing managers, business planners, market analysts, sales directors, and executives presenting data-driven decisions. Particularly suited for consumer goods, food service, retail, and financial industries when explaining customer segmentation, market share, and product portfolio analysis.
-
Slide Structure
Two-slide set with the first slide featuring a four-segment donut chart in brown, orange, blue, and gray with right-aligned text box explanations, and the second slide showing a yellow-accent donut chart variation. Both slides are optimized for 16:9 widescreen format with independently editable chart data and text elements.
Related Products
-

Donut Chart Comparing Market Share by Coffee Brand
#Market and Competitor Analysis #Diagram #Graph
-

Application Development Status Visualized with Doughnut Diagram
#Product/Service Introduction #Market and Competitor Analysis #Diagram
-

Vaccine Research Status Graph – Market and Competitive Analysis
#Market and Competitor Analysis #Diagram #Graph
-

Speed Timer Diagram for Market Share Analysis
#Market and Competitor Analysis #Diagram #Graph
