Red Market Share Slide – Compelling Donut Chart Design
RJ0800037_23
- Last Update 08/10/2025
- File Size 0.2MB
- # of Slides 2
- File Format PPTX
- Slide Ratio 16:9
- Color
Keywords
About the Product
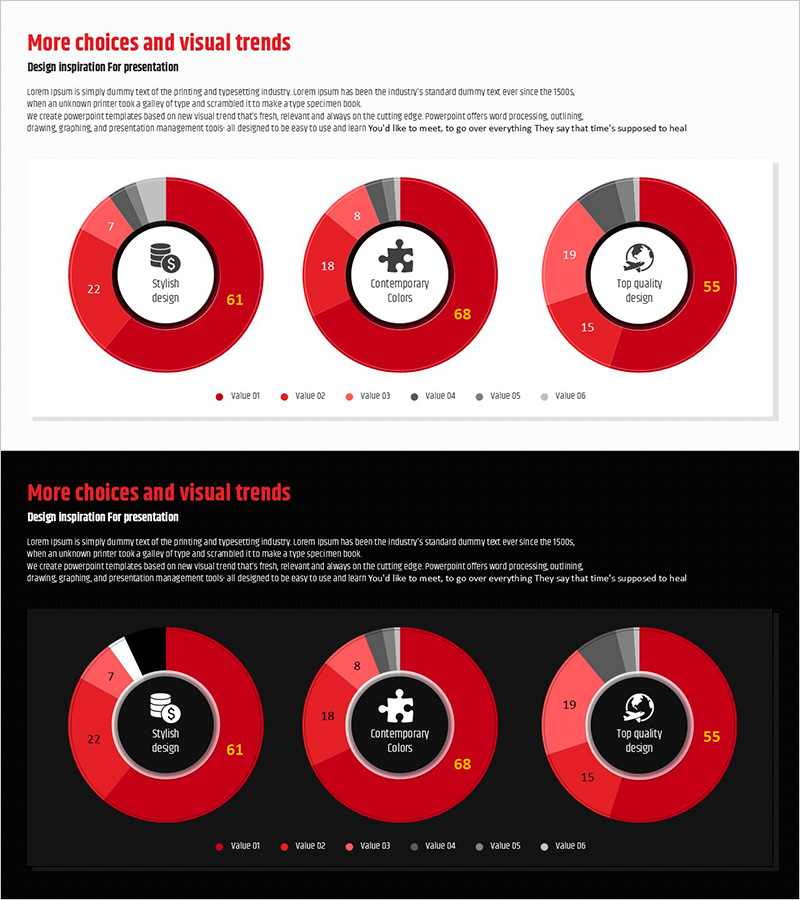
A donut chart PowerPoint slide designed for market share and competitive analysis presentations. The slide features a central icon with three-segment data visualization in the outer donut ring, enabling intuitive representation of proportional data. Red gradient tones emphasize key metrics while gray accent areas clarify information hierarchy. Immediately applicable to business presentations including marketing strategy, market analysis, and executive reports.
Usage Points
-
Main Usage
Visualizes proportional data such as market share, sales ratio, and customer composition. The central icon area highlights key messages or metrics, while the outer donut segments clearly represent each item's proportion within the total.
-
How to Use
Ideal for executive reports, market analysis presentations, quarterly performance reviews, and competitive benchmarking. Replace segment values and labels to apply to various proportional datasets. Customize color tones to align with corporate branding guidelines.
-
Recommended For
Marketing managers, executives, business development teams, financial analysts, and consultants requiring data-driven decision-making. Effective for quarterly reviews, strategy sessions, investor presentations, and internal management reports.
-
Slide Structure
Two-slide set featuring a central circular icon with outer donut ring segments. Three data items represented in red gradient tones with gray supporting areas for information hierarchy. Each segment includes numeric values and labels. 16:9 widescreen format optimized for modern presentation environments.
Related Products
-

World Map and Share Chart for Market Analysis – Effective Data Visualization
#Market and Competitor Analysis #Graph #Other
-

Donut Chart Comparing Market Share by Coffee Brand
#Market and Competitor Analysis #Diagram #Graph
-

Doughnut Chart for Market Share Analysis – Visualizing Data at a Glance
#Market and Competitor Analysis #Graph #Market Share
-

Work Progress Analysis Graph – Market Share Visualization
#Market and Competitor Analysis #Graph #Market Share
