Visualizing Market Share and Status with Pie Chart
RJ0400020_33
- Last Update 05/23/2025
- File Size 0.2MB
- # of Slides 2
- File Format PPTX
- Slide Ratio 16:9
- Color
Keywords
- #Content-Based Slides
- #Design-Based Slides
- #Market and Competitor Analysis
- #Graph
- #Market Status
- #Market Share
- #Circles
- #Pie Chart
- #16:9
- #pie chart PowerPoint slide
- #pie graph template
- #market share visualization
- #data proportion slide
- #how to create pie chart in PowerPoint
- #pie chart template download
About the Product
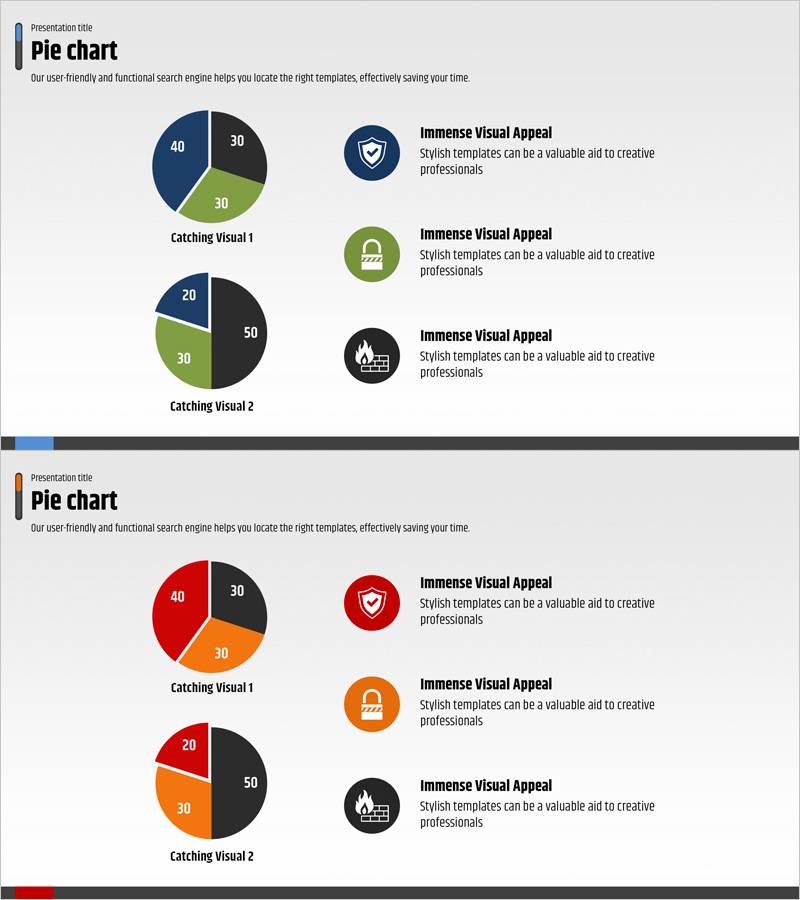
A 2-slide PowerPoint presentation template for visualizing market share and market status using pie charts. This deck features two distinct color versions: navy-green and red-orange combinations, each displaying 3-segment and 4-segment pie chart examples. The slides enable intuitive representation of numerical data and clear comparison of proportional relationships. Designed in 16:9 widescreen PPTX format for immediate editing and customization in your presentations.
Usage Points
-
Main Usage
Effectively communicate proportional data such as market share, sales distribution, customer composition, and budget allocation using pie charts. The template offers both 3-segment and 4-segment structures to accommodate varying numbers of data categories, with two color schemes to match your presentation style.
-
How to Use
Ideal for marketing reports, business analysis presentations, financial performance reviews, and market research findings. Simply replace the numerical values and labels with your own data, and optionally add icons or supplementary text to enhance information clarity and audience engagement.
-
Recommended For
Marketing professionals, executives, financial analysts, management consultants, and sales teams presenting market conditions and proportional data. Particularly effective for quarterly performance reports, customer segmentation analysis, and product portfolio composition explanations.
-
Slide Structure
Two-slide set with two pie chart examples per slide. First slide features navy-green-black color combination with 3-segment and 4-segment pie charts. Second slide presents red-orange-black color combination with matching 3-segment and 4-segment pie charts. Each chart includes adjacent icon and descriptive text areas for additional context.
Related Products
-

Agricultural Equipment Investment Plan Pie Chart
#Market and Competitor Analysis #Graph #Market Status
-

City and Nature Pie Chart Statistics – Visualization of Market Status
#Market and Competitor Analysis #Graph #Market Status
-

Two Pie Charts with Commentary – Market Share Analysis
#Market and Competitor Analysis #Graph #Market Status
-

Yellow Marketing Pie Chart – Market Share Analysis
#Market and Competitor Analysis #Graph #Market Status
