Market Share of Hybrid Vehicles - Pie Chart Visualization
RB0500017_5
- Last Update 03/13/2025
- File Size 1.9MB
- # of Slides 2
- File Format PPTX
- Slide Ratio 4:3
- Color
Keywords
About the Product
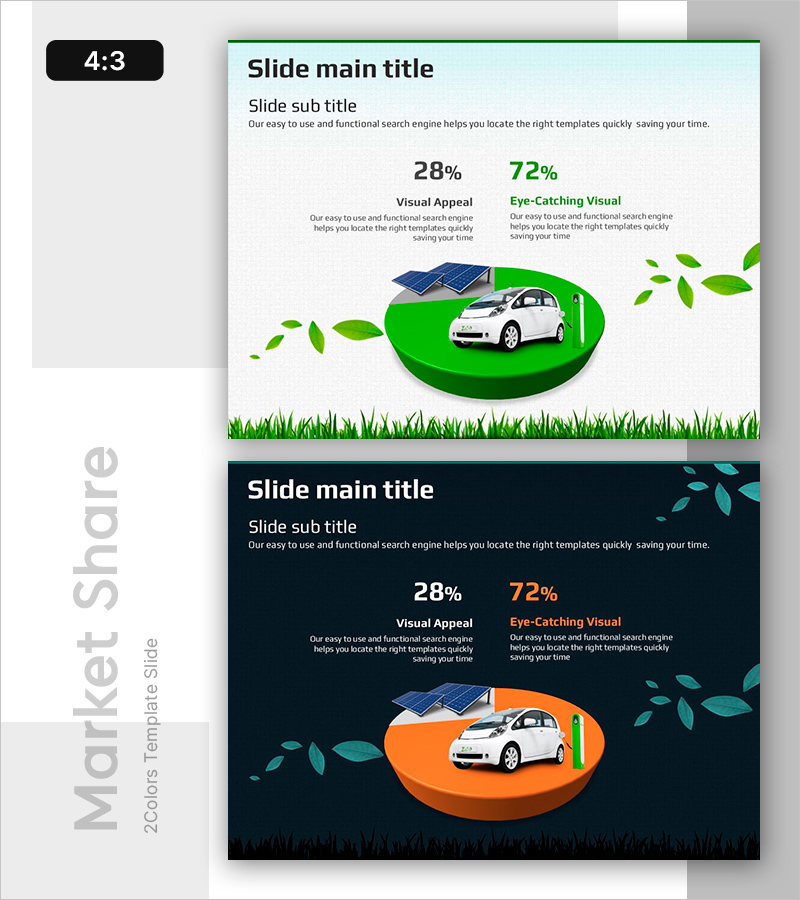
A two-segment pie chart PowerPoint slide designed to visualize hybrid vehicle market share and competitive positioning. Provided in two color versions—bright lime green and dark navy backgrounds—each slide features a pie chart displaying 28% and 72% proportions with accompanying descriptive text areas. The design incorporates eco-friendly illustrations including solar panels, electric vehicles, and grass elements to emphasize sustainability themes. Ideal for market analysis presentations, product introductions, business reports, and investment pitch decks. Fully editable template ready for immediate use in professional presentations.
Usage Points
-
Main Usage
Effectively visualize two-part data comparisons such as market share, sales ratios, customer demographics, or competitive positioning using a pie chart format. The clear percentage labels and segments enable audiences to quickly grasp the relative proportions of each category.
-
How to Use
Replace the 28% and 72% figures with your actual data values. Edit the left-side text area to add descriptions for each segment. Choose the lime green version for positive, energetic presentations or the dark navy version for professional, formal business reports. All chart colors, percentages, and text are fully customizable.
-
Recommended For
Automotive and energy industry marketing professionals, market research analysts, sales performance presenters, business plan and investment pitch deck creators, sustainability and environmental initiative presenters.
-
Slide Structure
2-slide set in 4:3 aspect ratio. Each slide contains: title area at top, centered 2-segment pie chart (lime green or orange accent), left-side text description area, right-side eco-themed illustrations (solar panels, electric vehicle, grass background). Percentage values and labels displayed on chart with fully editable text boxes.
Related Products
-

Two Pie Charts with Commentary – Market Share Analysis
#Market and Competitor Analysis #Graph #Market Status
-

Yellow Marketing Pie Chart – Market Share Analysis
#Market and Competitor Analysis #Graph #Market Status
-

Pie Chart for Workout Type Preferences – Market Status
#Market and Competitor Analysis #Diagram #Graph
-

Pie Chart for Market Share Analysis – Data Visualization
#Market and Competitor Analysis #Graph #Market Status
