Key Outcomes from Experimentation – Vision and Strategy
RB0400002_9
- Last Update 03/11/2025
- File Size 0.3MB
- # of Slides 2
- File Format PPTX
- Slide Ratio 4:3
- Color
Keywords
- #Content-Based Slides
- #Design-Based Slides
- #Business Vision and Strategy
- #Diagram
- #Business Goals
- #Business Background and Necessity
- #Flow
- #Cluster
- #Linear Flow
- #Chain Diagram
- #4:3
- #3-node connected diagram PowerPoint
- #circular node diagram slide
- #business strategy diagram
- #decision-making process PPT
- #key outcomes slide
- #relationship structure diagram
About the Product
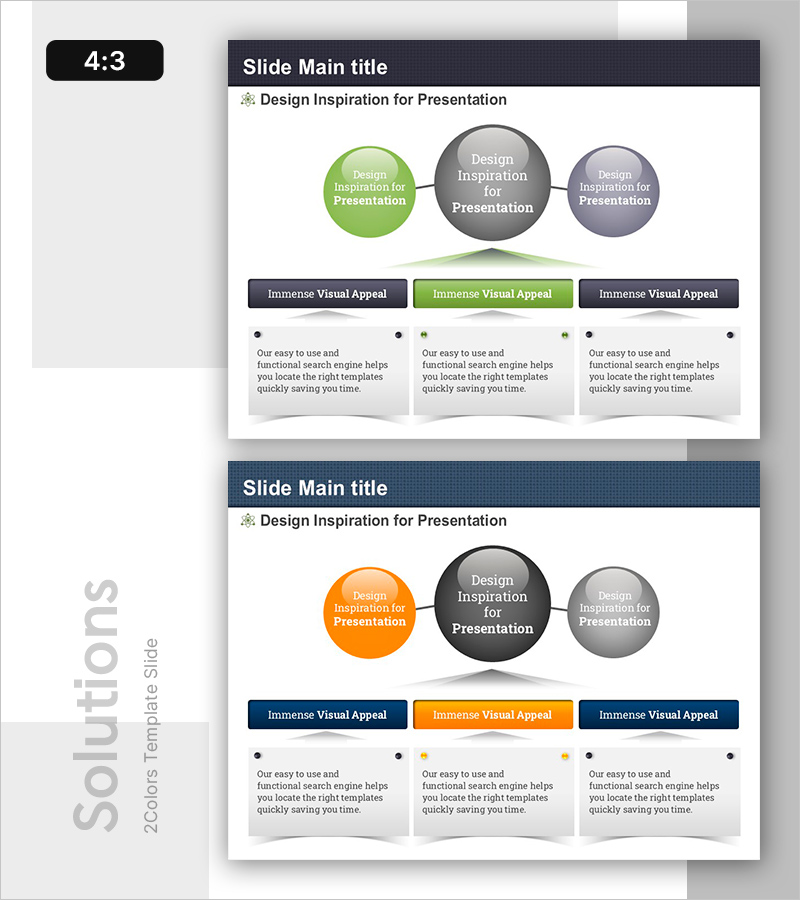
A horizontal three-node connection diagram PowerPoint slide featuring circular nodes in green, gray, and purple. The central gray node is flanked by symmetrical green (left) and purple (right) nodes, connected by horizontal lines. Below each node sits a color-matched accent box with descriptive text areas. Delivered as a 4:3 ratio, 2-slide set with color variations: slide 1 emphasizes green, slide 2 features orange accents. Ideal for expressing three strategic perspectives, decision-making processes, or key outcome frameworks in business presentations.
Usage Points
-
Main Usage
Visually represents three core elements or perspectives with equal weight and interconnected relationships. Effectively communicates causal structures such as vision-strategy-execution or problem-analysis-solution, with dedicated space for detailed explanations beneath each node.
-
How to Use
Place your central theme in the gray node and key elements in the left and right nodes. Add category labels in the colored accent boxes below each node and supporting descriptions in the text areas. Use the color-variant slide to repeat the same structure across different presentation contexts.
-
Recommended For
Executives, strategy teams, marketing professionals, and project leaders presenting business strategies, product launches, organizational restructuring, or decision frameworks. Particularly effective for experimental result analysis, performance reviews, and forward-looking strategic direction in three-step logical structures.
-
Slide Structure
Slide 1: Three circular nodes (green, gray, purple) connected horizontally with lines, three color-matched accent boxes below (dark gray, green, dark gray), three text areas. Slide 2: Identical structure with orange accent box variation. 4:3 aspect ratio, fully editable text and shapes in PPTX format.
Related Products
-

Overview of Pharmaceutical Development Business
#Business Vision and Strategy #Diagram #Business Goals
-

Effective Diagram Slide for Business Goal and Vision Setting
#Business Vision and Strategy #Diagram #Business Goals
-

Implementation Strategy and Goals – Business Flow and Cluster Structure
#Business Vision and Strategy #Diagram #Business Goals
-

List of Studies by Year Slide – Business Strategy and Vision
#Company Introduction #Business Vision and Strategy #Diagram
