Overview of Pharmaceutical Development Business
RB0400003_7
- Last Update 03/11/2025
- File Size 0.8MB
- # of Slides 2
- File Format PPTX
- Slide Ratio 4:3
- Color
Keywords
- #Content-Based Slides
- #Design-Based Slides
- #Business Vision and Strategy
- #Diagram
- #Business Goals
- #Business Background and Necessity
- #Flow
- #Cluster
- #Linear Flow
- #Chain Diagram
- #4:3
- #three-circle diagram PowerPoint
- #connection diagram slide template
- #comparative structure presentation
- #circular node diagram
- #business strategy slide design
About the Product
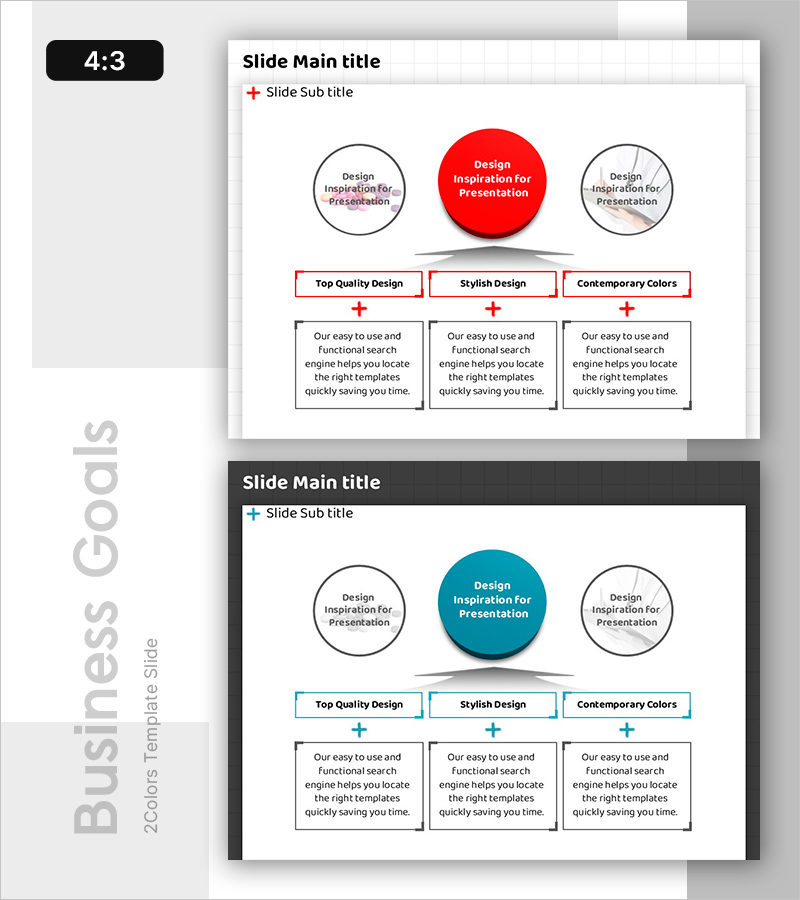
A three-circle connection diagram PowerPoint slide featuring a central red circle flanked by two gray circles, creating a clear visual hierarchy for comparative analysis. The red center circle emphasizes the primary concept while the gray supporting circles represent related elements, connected by plus (+) symbols for visual linkage. Each circle is paired with a text box below for detailed descriptions, enabling systematic information organization. This 4:3 ratio, 2-slide template is ready for immediate use in business strategy presentations, product comparisons, organizational structures, and cross-functional analysis.
Usage Points
-
Main Usage
Designed to express relationships between a primary concept and supporting elements using a three-tier structure. The central red circle emphasizes the main topic while the flanking gray circles position secondary concepts, creating clear information hierarchy and visual impact.
-
How to Use
Enter key messages within each circle and detailed explanations in the text boxes below. Present connected items sequentially using the plus symbol connectors, leveraging color contrast to emphasize importance. Apply to business strategy presentations, product comparative analysis, organizational structure explanations, and cross-functional relationship mapping.
-
Recommended For
Ideal for executive and management presentations explaining core objectives and execution strategies during business planning phases. Effective for pharmaceutical development teams describing key stages and related factors in drug development processes, and for marketing teams structuring target audience, value propositions, and competitive advantages.
-
Slide Structure
Central red circle (approximately 120px diameter) with left and right gray circles (approximately 80px diameter each) arranged horizontally. Three text boxes positioned below each circle with plus (+) symbols indicating connections. Title and subtitle areas at the top, organized across 2 slides in 4:3 ratio.
Related Products
-

Key Outcomes from Experimentation – Vision and Strategy
#Business Vision and Strategy #Diagram #Business Goals
-

Functional Value Proposition Slide – Business Strategy Presentation
#Business Vision and Strategy #Diagram #Business Strategy
-

Effective Diagram Slide for Business Goal and Vision Setting
#Business Vision and Strategy #Diagram #Business Goals
-

Implementation Strategy and Goals – Business Flow and Cluster Structure
#Business Vision and Strategy #Diagram #Business Goals
