Animal Trait Distribution Pie Chart – Market and Competitor Analysis
RB0300019_4
- Last Update 03/10/2025
- File Size 0.7MB
- # of Slides 2
- File Format PPTX
- Slide Ratio 4:3
- Color
Keywords
- #Content-Based Slides
- #Design-Based Slides
- #Market and Competitor Analysis
- #Diagram
- #Graph
- #Competitor Analysis
- #Market Analysis
- #Cluster
- #Circles
- #Closed Cluster Diagram
- #Pie Chart
- #4:3
- #pie chart PowerPoint slide
- #4-segment pie chart template
- #data ratio visualization PowerPoint
- #market analysis pie chart
- #competitor analysis slide
- #percentage chart presentation
About the Product
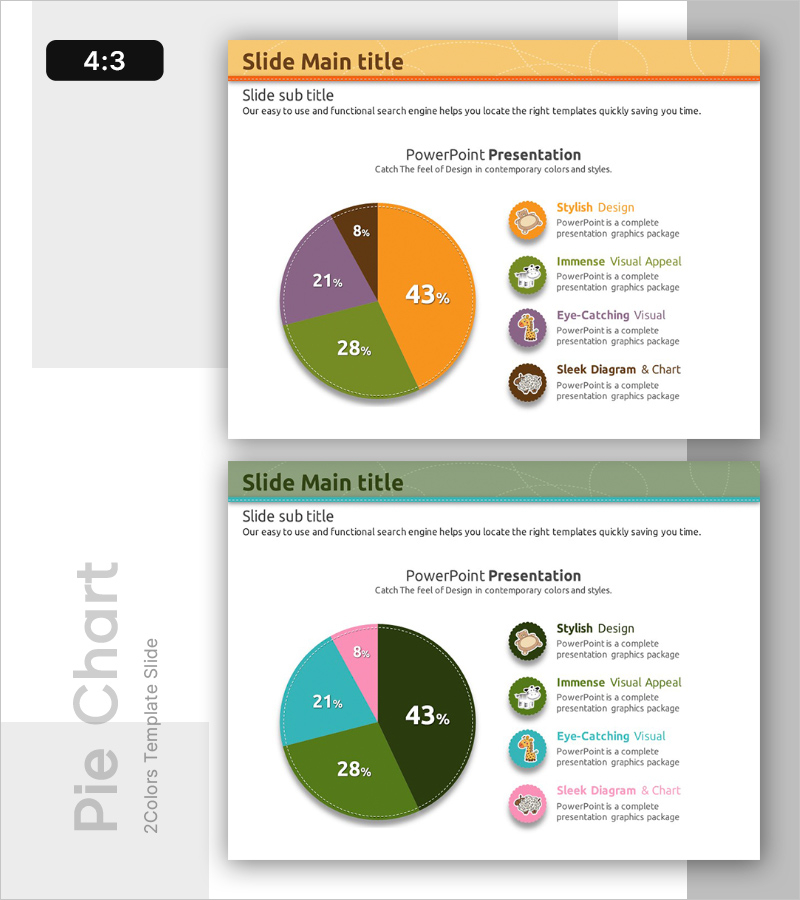
A PowerPoint pie chart slide optimized for market analysis and competitor comparison presentations. This slide deck features a four-segment pie chart with orange (43%), green (28%), purple (21%), and brown (8%) sections, paired with icon-labeled descriptions on the right side. The circular chart and text box layout creates a professional, easy-to-understand data visualization suitable for business reports, marketing plans, and executive presentations. The 4:3 aspect ratio with 2 slides allows flexible editing for various data scenarios.
Usage Points
-
Main Usage
Visualizes four-category ratio data such as market share, competitor comparison, customer demographics, or product sales breakdown using a pie chart format. Each segment displays percentage values with corresponding icon-labeled descriptions on the right, enabling audiences to quickly grasp the data relationships.
-
How to Use
Replace the pie chart percentages (43%, 28%, 21%, 8%) with your actual data values. Edit the item names and descriptions in the right-side text boxes, and swap or remove icons to match your category. Colors can be adjusted to align with your brand guidelines.
-
Recommended For
Marketing professionals, executives, business analysts, and consultants presenting market conditions, competitive landscape, customer segmentation, or product portfolio analysis. Ideal for quarterly performance reports, investor presentations, and strategic planning meetings.
-
Slide Structure
2-slide set with identical layout for flexible data presentation. Each slide features a four-segment pie chart on the left with orange, green, purple, and brown sections, and four icon-labeled description boxes on the right. 4:3 aspect ratio ensures compatibility with all standard projectors and displays.
Related Products
-

Logistics Data by Year Pie Chart – Strategy for Competitor Analysis
#Market and Competitor Analysis #Diagram #Graph
-

Brain Data Analysis Radial Graph – Insights on Technology and Market
#Market and Competitor Analysis #Diagram #Graph
-

Spaceship Launch Analysis Graph – Ideal for Competitor Analysis
#Market and Competitor Analysis #Diagram #Graph
-

Competitor Market Analysis Broken Line Graph – Enhance Business Strategy with Data Visualization
#Market and Competitor Analysis #Diagram #Graph
