Spaceship Launch Analysis Graph – Ideal for Competitor Analysis
RJ0700020_19
- Last Update 07/27/2025
- File Size 1.4MB
- # of Slides 2
- File Format PPTX
- Slide Ratio 16:9
- Color
Keywords
- #Content-Based Slides
- #Design-Based Slides
- #Market and Competitor Analysis
- #Diagram
- #Graph
- #Other
- #Competitor Analysis
- #Market Analysis
- #Cluster
- #Closed Cluster Diagram
- #16:9
- #stacked area chart PowerPoint
- #area graph slide template
- #data comparison presentation
- #market analysis chart
- #competitor analysis PPT slide
About the Product
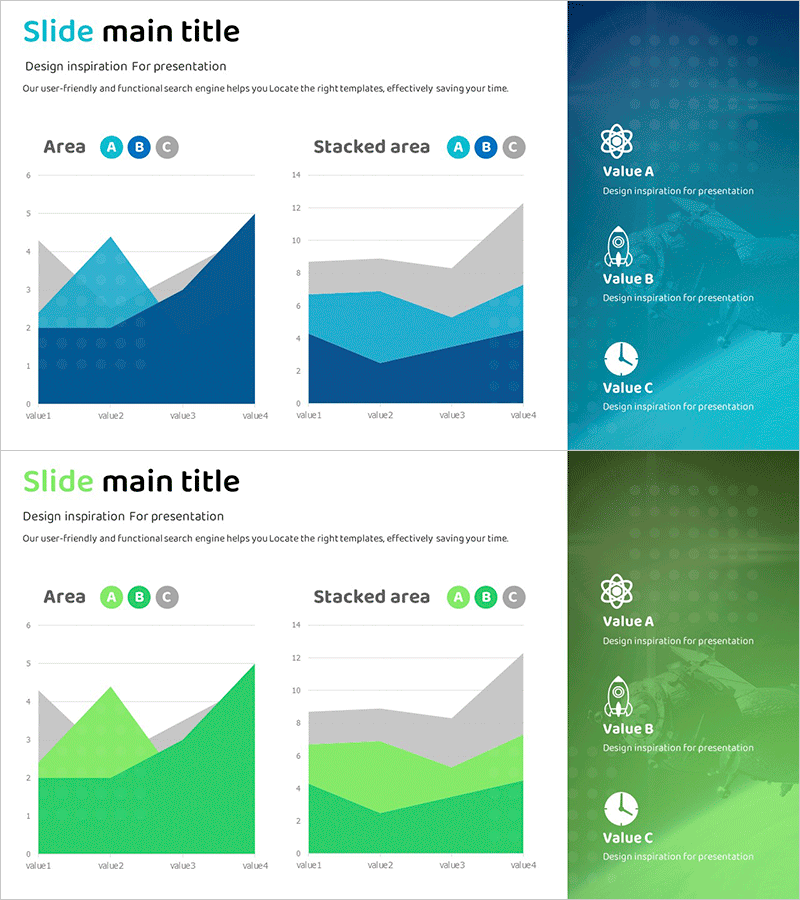
A stacked area chart PowerPoint slide optimized for competitor analysis and market trend comparison. This presentation template features two distinct layouts: a standard area chart and a stacked area chart, both displaying three data series in blue, light blue, and gray gradients. Each slide visualizes four data points (value1 through value4), enabling simultaneous representation of numerical changes over time and compositional ratios. Instantly applicable to business presentations including spaceship launch project progress tracking, competitor market share trends, product sales volume analysis, and strategic market positioning reports.
Usage Points
-
Main Usage
Designed to simultaneously express multiple data series trends over time and compositional ratios. Ideal for visualizing competitor market share evolution, product sales composition, project resource allocation by phase, and complex multi-layered business data analysis.
-
How to Use
Slide 1 presents a standard area chart emphasizing individual series trends, while Slide 2 displays a stacked area chart showing total aggregate and each series' contribution. Replace legend labels A, B, C with actual item names and input your data values for immediate use in presentations.
-
Recommended For
Recommended for executive reports, business performance analysis, marketing strategy presentations, investor pitch decks, and market research findings. Particularly suited for professionals (executives, planners, analysts, marketers) handling multi-layered data in competitor analysis, market trend comparison, and product portfolio performance evaluation.
-
Slide Structure
2-slide set. Slide 1: Standard area chart (3 series, 4 data points, blue-light blue-gray gradient). Slide 2: Stacked area chart (same 3 series, cumulative display). Right sidebar includes Value A, B, C icon legend area. 16:9 aspect ratio, PPTX format.
Related Products
-

3 Radial Charts and Analysis – Competitor and Market Trends
#Market and Competitor Analysis #Diagram #Graph
-

Graph Slide for Market and Competitor Analysis – Online Market Overview
#Market and Competitor Analysis #Diagram #Graph
-

Market Analysis Graph Ahead of the Future – Innovative Business Insights
#Market and Competitor Analysis #Diagram #Graph
-

Botanic Garden and Bar Chart – Visualization for Market Analysis
#Market and Competitor Analysis #Diagram #Graph
