Brain Data Analysis Radial Graph – Insights on Technology and Market
RJ0700025_28
- Last Update 07/29/2025
- File Size 1.3MB
- # of Slides 2
- File Format PPTX
- Slide Ratio 16:9
- Color
Keywords
- #Content-Based Slides
- #Design-Based Slides
- #Market and Competitor Analysis
- #Diagram
- #Graph
- #Competitor Analysis
- #Market Analysis
- #Cluster
- #Other
- #Closed Cluster Diagram
- #Radar Chart Spider Chart
- #16:9
- #radial chart PowerPoint
- #radar chart slide template
- #data analysis presentation
- #market analysis PPT
- #competitive analysis chart
- #multi-axis graph template
About the Product
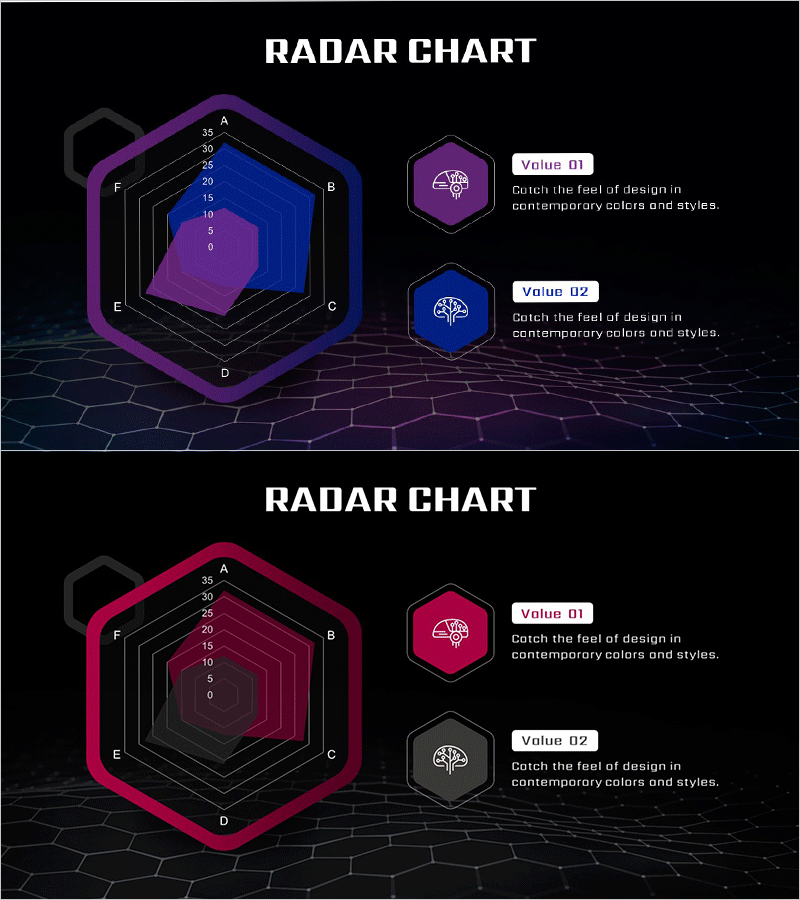
A 6-axis radial chart PowerPoint slide designed for technology and market analysis. The multi-layered radar chart rendered in purple and blue gradients enables instant comparison of complex datasets. Brain icons and hexagonal frames emphasize technical expertise, while the 0–35 numeric scale supports quantitative evaluation. The 2-slide set accommodates diverse data scenarios and is ready to use in 16:9 widescreen format for immediate presentation deployment.
Usage Points
-
Main Usage
Visualizes multidimensional data such as technical capabilities, market share, competitive positioning, and organizational competencies simultaneously. The 6-axis structure compares up to 6 metrics, with a 0–35 numeric range for precise quantitative representation.
-
How to Use
Insert into business plan market analysis sections, investment pitch deck competitive analysis pages, and strategic report capability assessment slides. Replace Value 01 and Value 02 labels with actual data names and edit hexagon values for immediate presentation use.
-
Recommended For
Marketing managers, strategy planners, data analysts, consultants, and investment professionals presenting complex datasets persuasively. Ideal for technology firms, IT startups, and market research companies seeking professional data visualization.
-
Slide Structure
Two 6-axis radial radar chart variants. Each slide features a central hexagonal frame, 6 axis labels (A–F), 2 data series (purple and blue gradients), and a right-aligned legend with Value 01·02 and icons. Black background with grid pattern reinforces technical aesthetics.
Related Products
-

VR Market Analysis Bar Graph
#Market and Competitor Analysis #Diagram #Graph
-

Geometry PPT Template Wide Radar Chart – Market and Competitor Analysis
#Market and Competitor Analysis #Graph #Competitor Analysis
-

Characteristics of Seasonal Forests – Market and Competitor Analysis
#Market and Competitor Analysis #Diagram #Text Box
-

Mobile SNS Market Analysis Graph – Visualizing Competitor Analysis Data
#Market and Competitor Analysis #Diagram #Graph
