Diagram for Sustainable Market Size Analysis & Competitor Insights
RB0100040_9
- Last Update 03/05/2025
- File Size 0.4MB
- # of Slides 2
- File Format PPTX
- Slide Ratio 4:3
- Color
Keywords
- #Content-Based Slides
- #Design-Based Slides
- #Market and Competitor Analysis
- #Diagram
- #Market Status
- #Market Analysis
- #Flow
- #Multidirectional Flow
- #4:3
- #radial diagram PowerPoint slide
- #market analysis presentation template
- #competitor analysis diagram
- #dual-color comparison slide
- #data visualization PowerPoint
About the Product
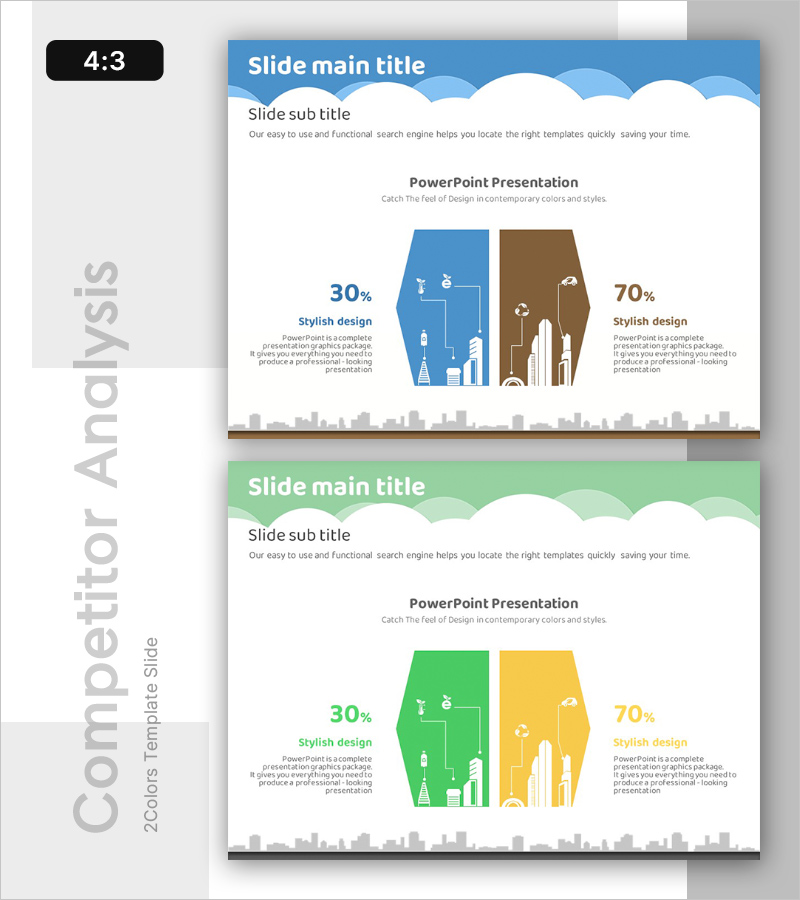
A radial diagram PowerPoint slide designed for sustainable market size and competitor analysis presentations. The slide features two contrasting color schemes—blue and brown—with city silhouette nodes that visually compare market data. Percentage values and descriptive text are strategically positioned to enhance information clarity. Formatted in 4:3 aspect ratio with 2 slides, this presentation template is ready for immediate use in market analysis sections of business pitches, investor decks, and strategic reports.
Usage Points
-
Main Usage
Transform market size analysis and competitor comparison data into a radial node structure that enhances audience comprehension. The contrasting blue and brown color scheme clearly differentiates two market scenarios or competitive positioning strategies in a single visual framework.
-
How to Use
Integrate this slide into business plans, investor pitch decks, and market analysis reports within the market overview section. Edit the percentage values and text labels to input your actual market data. The city silhouette icons can represent regional market distribution or urban-scale market segments.
-
Recommended For
Ideal for executives, marketing managers, and business development teams presenting market analysis findings to senior leadership or investors. Particularly effective for pitches emphasizing sustainability-focused business models or ESG-driven corporate strategies.
-
Slide Structure
Two-slide set with consistent design. Slide 1 features a blue background with radial nodes (30% metric, city icon, text area); Slide 2 mirrors the layout with brown background (70% metric). Cloud-shaped decorative elements at the top and city skyline silhouettes at the bottom create visual cohesion throughout.
Related Products
-

Chemical Experiment Analysis Broken Line Graph – Insights and Data Visualization
#Market and Competitor Analysis #Diagram #Graph
-

3D Vertical Segmentation Graph – Market Analysis
#Market and Competitor Analysis #Graph #Market Status
-

Office Supplies Theme Bundle Bar Graph – Market Status Analysis
#Market and Competitor Analysis #Graph #Market Status
-

Analyze Market with Aurora Bending Line Chart – Competition and Opportunities
#Market and Competitor Analysis #Graph #Market Status
