Horizontal Bar Chart Slide for USA Market Analysis
RJ0400017_24
- Last Update 05/22/2025
- File Size 0.3MB
- # of Slides 2
- File Format PPTX
- Slide Ratio 16:9
- Color
Keywords
About the Product
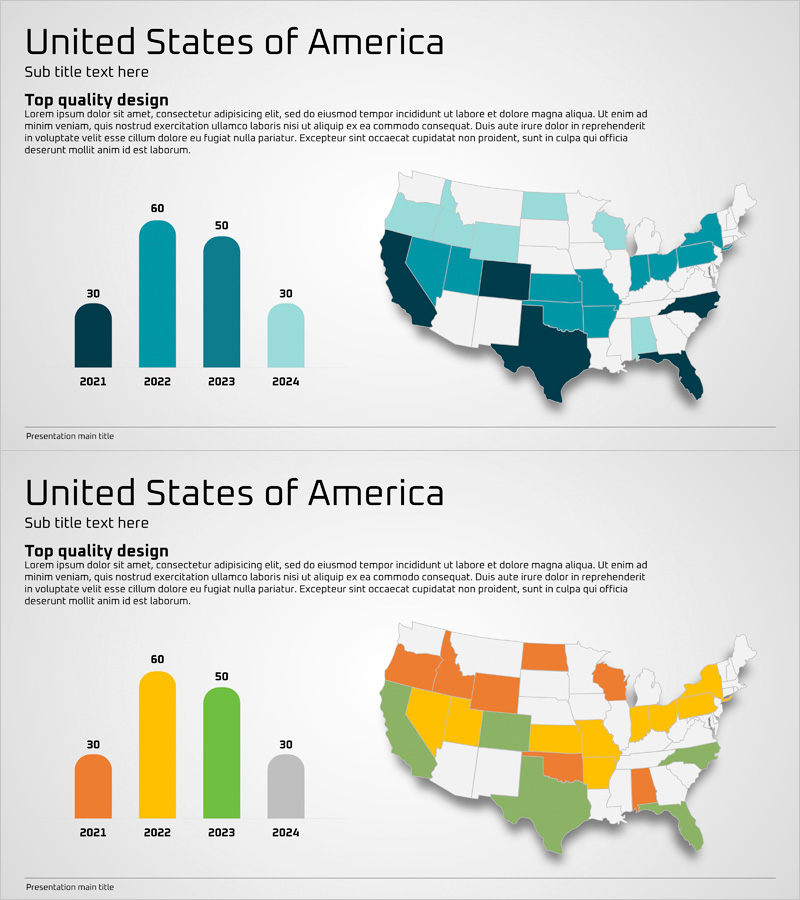
A 2-slide PowerPoint presentation combining a choropleth map of the United States with vertical bar charts to visualize market performance across regions and years. The first slide displays state-level data using a three-tier color gradient (dark teal, medium teal, light teal) on the USA map, while the second slide presents a 4-year trend (2021–2024) using rounded vertical bars with precise numerical labels. Delivered in 16:9 widescreen PPTX format, fully editable and ready for market analysis presentations, regional performance comparisons, and year-over-year growth discussions.
Usage Points
-
Main Usage
Communicate both geographic distribution and temporal trends in US market data through dual visualization methods. The map highlights regional disparities while the bar chart emphasizes year-over-year growth patterns, enabling stakeholders to understand market dynamics from spatial and temporal perspectives simultaneously.
-
How to Use
Present the first slide to establish regional context using color-coded state data, then transition to the second slide to detail numerical trends across 2021–2024. Use this combination in market strategy presentations, quarterly business reviews, investor pitches, and regional expansion planning sessions to support data-driven decision-making.
-
Recommended For
Marketing and sales teams presenting regional performance metrics, executive leadership reviewing market expansion strategies, investor relations professionals preparing pitch decks, business development managers analyzing geographic market potential, and any organization requiring state-level or regional data visualization for strategic planning.
-
Slide Structure
Slide 1: USA choropleth map with 4-tier color coding (dark teal, medium teal, light teal, white) representing state-level data / Slide 2: Four rounded vertical bars (2021–2024) with numerical labels and year indicators. 16:9 widescreen format, PPTX file with all elements fully editable and customizable.
Related Products
-

Idea Presentation Template Wide – Market Analysis and Visualization
#Market and Competitor Analysis #Graph #Other
-

Weather Change Vertical Bar Graph Analysis - Understanding Market Status
#Market and Competitor Analysis #Graph #Market Status
-

Fantastic Wide PowerPoint Map & Bar Chart
#Company Introduction #Market and Competitor Analysis #Graph
-

Target Country Analysis Bar Graph – Insights into Global Markets
#Company Introduction #Market and Competitor Analysis #Graph
