Table Template for Data Summary – Efficient Planning
RB0700008_8
- Last Update 03/15/2025
- File Size 0.4MB
- # of Slides 2
- File Format PPTX
- Slide Ratio 4:3
- Color
Keywords
- #Content-Based Slides
- #Design-Based Slides
- #Market and Competitor Analysis
- #Diagram
- #Market Status
- #Market Analysis
- #Table
- #Standard Table
- #4:3
- #table PowerPoint slide
- #data table template
- #horizontal table design
- #numerical comparison slide
- #blue header table
- #data organization PPT
- #how to create data table in PowerPoint
About the Product
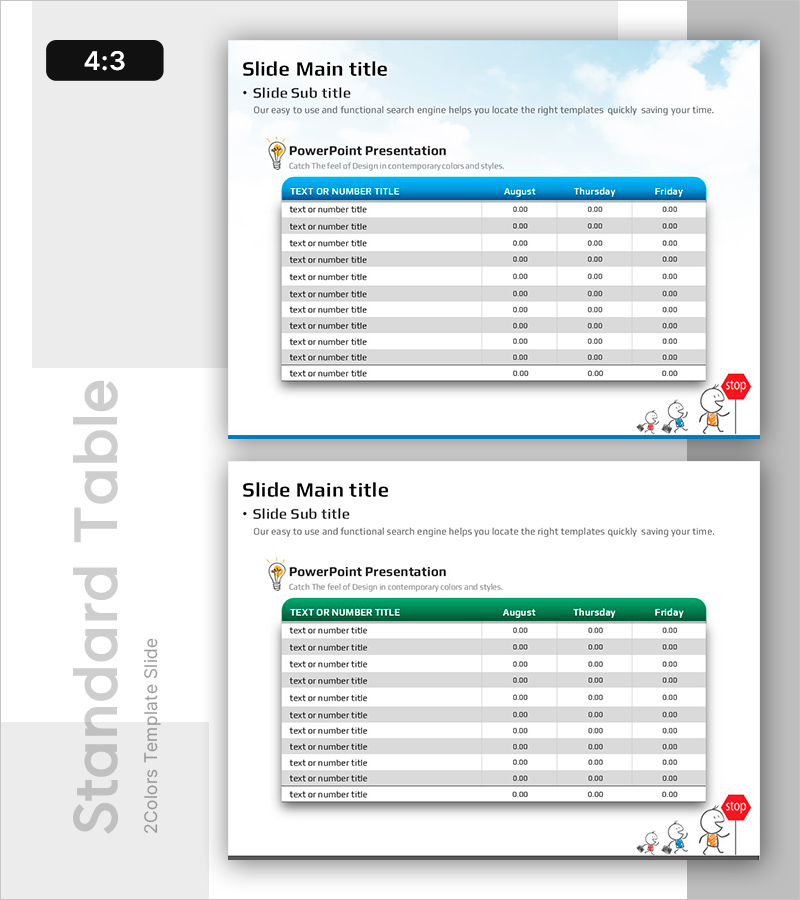
A horizontal table PowerPoint slide designed for organizing and comparing numerical data such as project schedules, sales performance, and budget status. The blue header and gray row dividers enhance data readability, with 11 rows and 3 columns enabling quick comparison of monthly, weekly, or category-based information. This presentation slide is ideal for reports, proposals, and business presentations where clear numerical data communication is essential.
Usage Points
-
Main Usage
Organize and compare numerical data including project timelines, sales figures, budget allocations, and performance metrics. The blue header and gray row divisions create clear information hierarchy, enabling audiences to quickly understand and analyze data presented in the slide.
-
How to Use
Insert into the performance section of reports, planning timeline sections of proposals, or financial status pages of investment materials. Simply select and replace existing text and numbers to fit your data; the cells automatically adjust. Colors and fonts can be customized to match your overall presentation theme.
-
Recommended For
Finance managers, project managers, marketing planners, and sales representatives presenting monthly, weekly, or category-based numerical data. Useful in business plans, quarterly reports, performance analysis documents, and budget proposals to enhance data credibility and clarity.
-
Slide Structure
Two-slide set featuring a horizontal table with blue header (TEXT OR NUMBER TITLE) containing 11 rows and 3 columns (August, Thursday, Friday). The second slide provides an identical table structure with a green header, allowing color differentiation across document sections for visual organization.
Related Products
-

Standard Blood Sugar Table by Year
#Market and Competitor Analysis #Diagram #Market Status
-

Usage Analysis Graph – Visualizing Market Status
#Market and Competitor Analysis #Diagram #Graph
-

Touch Wide Slide Template – Column Chart & Table
#Market and Competitor Analysis #Diagram #Graph
-

Child Traffic Education Implementation Table – Market Analysis and Execution Plan
#Market and Competitor Analysis #Diagram #Market Status
