Market Analysis Vertical Bar Graph
RJ0400016_8
- Last Update 05/21/2025
- File Size 0.3MB
- # of Slides 2
- File Format PPTX
- Slide Ratio 16:9
- Color
Keywords
About the Product
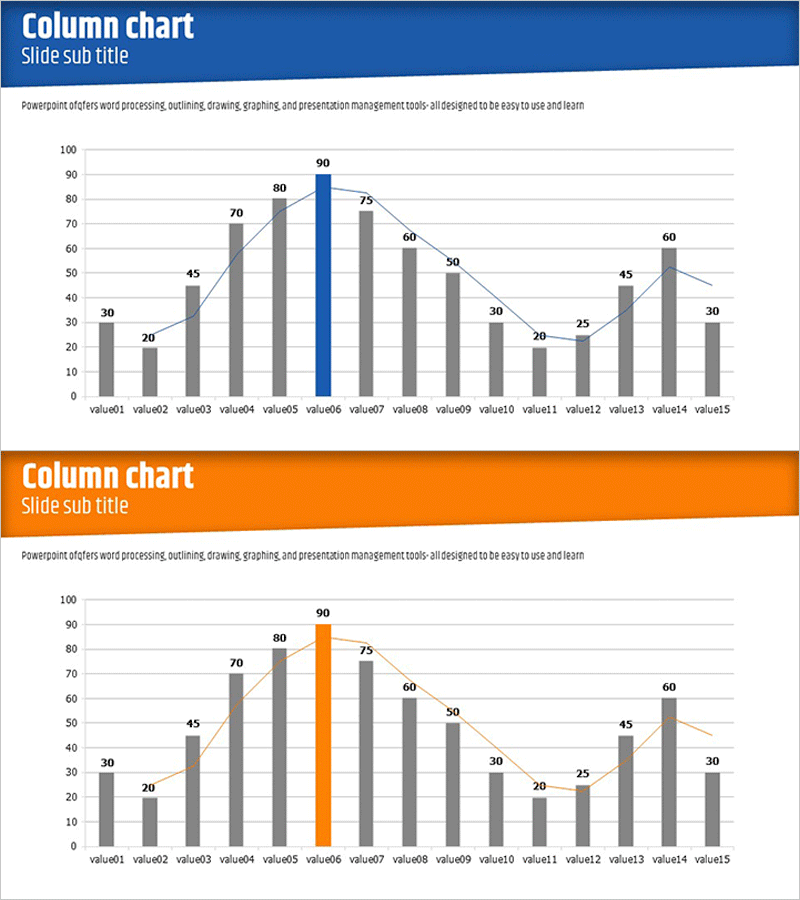
A vertical column mixed chart PowerPoint slide optimized for market analysis and business data comparison. This presentation template displays 15 data points using gray columns, highlights key metrics (value06) in blue, and overlays a trend line to show patterns simultaneously. The dark blue header contrasts with the white background for enhanced data readability, and the slide is formatted for 16:9 widescreen displays. This PowerPoint slide is ready to use in marketing plans, business reports, market analysis presentations, and executive briefings.
Usage Points
-
Main Usage
Effectively present multiple datasets such as market conditions, sales performance, and competitor comparisons on a single slide. The column graph compares absolute values across items while the trend line visualizes overall patterns, adding depth to data interpretation.
-
How to Use
Apply this slide to the market analysis section of marketing plans, performance analysis in business reports, and market size explanations in investor pitch decks. Customize the blue highlight column to emphasize different metrics, and edit values and legends to match your specific data.
-
Recommended For
Marketing professionals, executives, data analysts, and consultants who need to present market conditions and performance results persuasively. Particularly effective in strategy meetings and executive briefings where multiple indicators must be compared.
-
Slide Structure
Two-slide set featuring a dark blue header with 15 gray columns, one blue highlight column, and an overlay trend line on the first slide. The second slide uses an orange header with the same data structure in alternate colors for comparative analysis.
Related Products
-

Comparative Mixed Graph – Market and Competitor Analysis
#Market and Competitor Analysis #Graph #Market Status
-

Business Analysis Line Graph – Visualizing Market Trends
#Market and Competitor Analysis #Graph #Market Status
-

Residential Lighting Graph – Market Analysis
#Market and Competitor Analysis #Graph #Other
-

Blue Pink Market Analysis Segmented Vertical Bar Graph
#Market and Competitor Analysis #Graph #Market Status
