Youth Employment Status Data Infographic – Market Analysis and Strategy
RM0900006_6
- Last Update 10/05/2025
- File Size 0.2MB
- # of Slides 2
- File Format PPTX
- Slide Ratio 16:9
- Color
Keywords
- #Content-Based Slides
- #Design-Based Slides
- #Business Strategy
- #Market and Competitor Analysis
- #Diagram
- #Achievements
- #Market Status
- #Flow
- #Table
- #Linear Flow
- #Standard Table
- #16:9
- #data table PowerPoint slide
- #comparison table template
- #5-row table design
- #time-series data visualization
- #employment analysis slide
About the Product
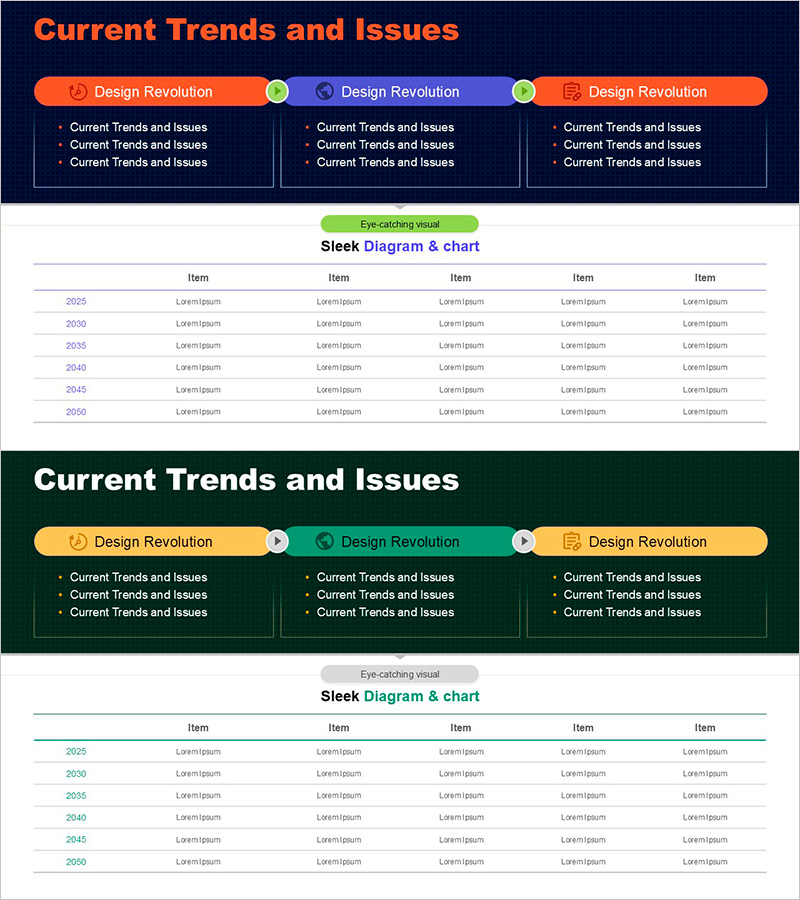
A 5-row data table PowerPoint slide designed for presenting youth employment status and market analysis information. The slide features a 5-column layout spanning years 2025 to 2050, enabling side-by-side comparison of trends over time. Set against a navy background with white text and light gray row dividers for enhanced readability, the slide includes a green badge section header that clearly establishes information hierarchy. Ideal for business strategy presentations and statistical data visualization, this slide template is ready for immediate editing and customization with your own data.
Usage Points
-
Main Usage
Organizes and compares statistical data or metrics across time periods and categories. Effectively communicates quantitative information such as youth employment trends, market size evolution, business performance indicators, and other numerical datasets in tabular format.
-
How to Use
Insert into the market analysis or business strategy section of your presentation. Double-click table cells to edit text directly, input your data, and adjust row counts or color schemes as needed for your specific content.
-
Recommended For
Recommended for executives, business analysts, consultants, and researchers preparing management reports, business plans, market analysis documents, investment pitch decks, and policy proposals requiring structured statistical presentation.
-
Slide Structure
Navy background slide with a green badge section header at the top and a centered 5-row by 5-column data table. The first row displays years (2025–2050), while the remaining four rows provide data entry fields. Row dividers and text alignment ensure clear information hierarchy and readability.
Related Products
-

Animal Performance Graphs PowerPoint Template
#Business Vision and Strategy #Business Strategy #Diagram
-

Healthy Food Ingredients and Area Charts
#Business Strategy #Market and Competitor Analysis #Graph
-

Sewing Graph Chart – Market Status and Performance Analysis
#Business Strategy #Market and Competitor Analysis #Diagram
-

Stakeholder Value Proposition Slide
#Product/Service Introduction #Market and Competitor Analysis #Diagram
