Animal Performance Graphs PowerPoint Template
RJ0500026_18
- Last Update 06/14/2025
- File Size 0.4MB
- # of Slides 2
- File Format PPTX
- Slide Ratio 16:9
- Color
Keywords
- #Content-Based Slides
- #Design-Based Slides
- #Business Vision and Strategy
- #Business Strategy
- #Diagram
- #Business Goals
- #Achievements
- #Flow
- #Linear Flow
- #16:9
- #arrow bar chart PowerPoint
- #performance comparison slide
- #animal character graph
- #business metrics visualization
- #bar chart PowerPoint slide template
About the Product
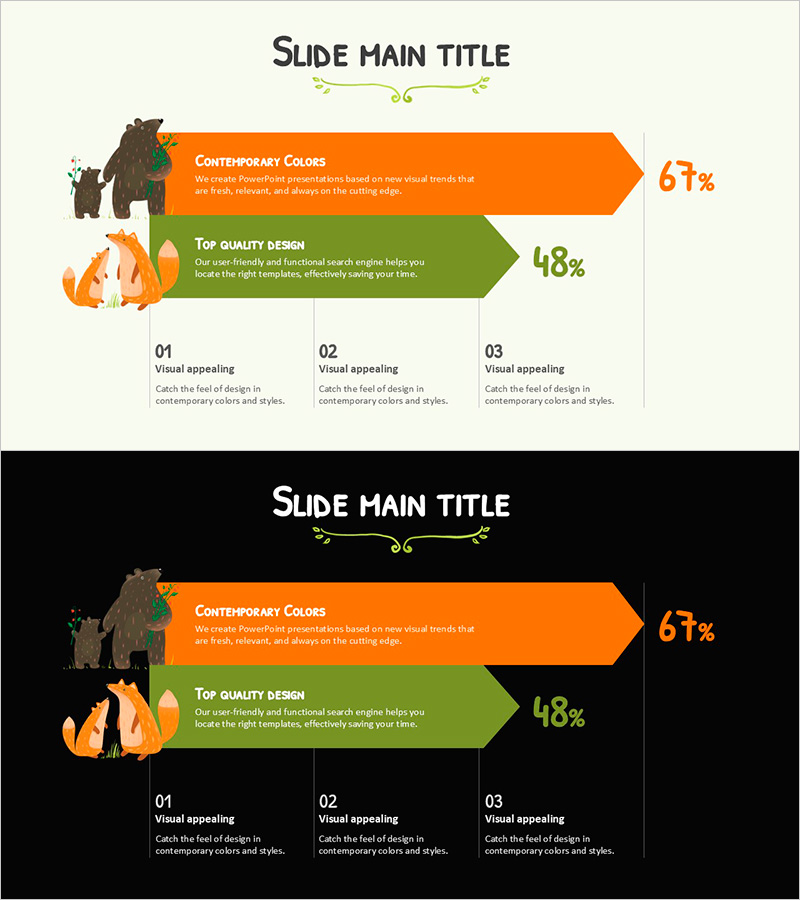
Arrow-shaped bar chart PowerPoint slide featuring animal characters for performance visualization. Two horizontal arrow boxes in orange and green display comparative metrics with percentage values on the right side, creating an intuitive data comparison layout. Left-side animal illustrations (bear and fox) add visual appeal and approachability to your presentation. The slide includes a title section at the top and three descriptive items at the bottom. Ready-to-use PowerPoint template for business strategy presentations, performance reports, and marketing analysis slides.
Usage Points
-
Main Usage
Visualize two-item performance metrics, achievement rates, and comparative analysis using arrow bar charts. Percentage values are clearly displayed alongside the bars, enabling precise quantitative comparison. Animal characters engage the audience and create a friendly, approachable presentation atmosphere.
-
How to Use
Use in business strategy presentations, quarterly performance reports, marketing campaign result analysis, and departmental goal achievement comparisons. Edit the title section and three descriptive areas at the bottom to customize the slide for your specific context and messaging.
-
Recommended For
Executives, marketing professionals, sales managers, project managers, and consultants who need to communicate quantitative results persuasively. Ideal for quarterly review meetings, strategic planning sessions, and client presentations.
-
Slide Structure
2-slide set with light background (top) and black background (bottom) versions. Each slide features left-side animal illustration, center orange and green arrow boxes (text + percentage), right-side numerical display, top title area, and bottom three-item description section.
Related Products
-

Marketing Goal Strategies to Increase Sales
#Business Vision and Strategy #Marketing Plan and Strategy #Diagram
-

Black Friday Main Objective and Strategy Slide
#Business Vision and Strategy #Diagram #Business Strategy
-

Business Linear Direction Diagram – Visualization of Business Strategy and Goals
#Business Vision and Strategy #Diagram #Business Strategy
-

Goal and Strategy Arrow Diagram – Clarifying Business Objectives
#Business Vision and Strategy #Operational Plan #Diagram
