Healthy Food Ingredients and Area Charts
RJ0600069_14
- Last Update 07/08/2025
- File Size 4.9MB
- # of Slides 2
- File Format PPTX
- Slide Ratio 16:9
- Color
Keywords
- #Content-Based Slides
- #Design-Based Slides
- #Business Strategy
- #Market and Competitor Analysis
- #Graph
- #Other
- #Achievements
- #Market Status
- #16:9
- #area chart PowerPoint slide
- #data visualization presentation template
- #two-layer area chart design
- #market analysis PPT
- #how to create area charts in PowerPoint
About the Product
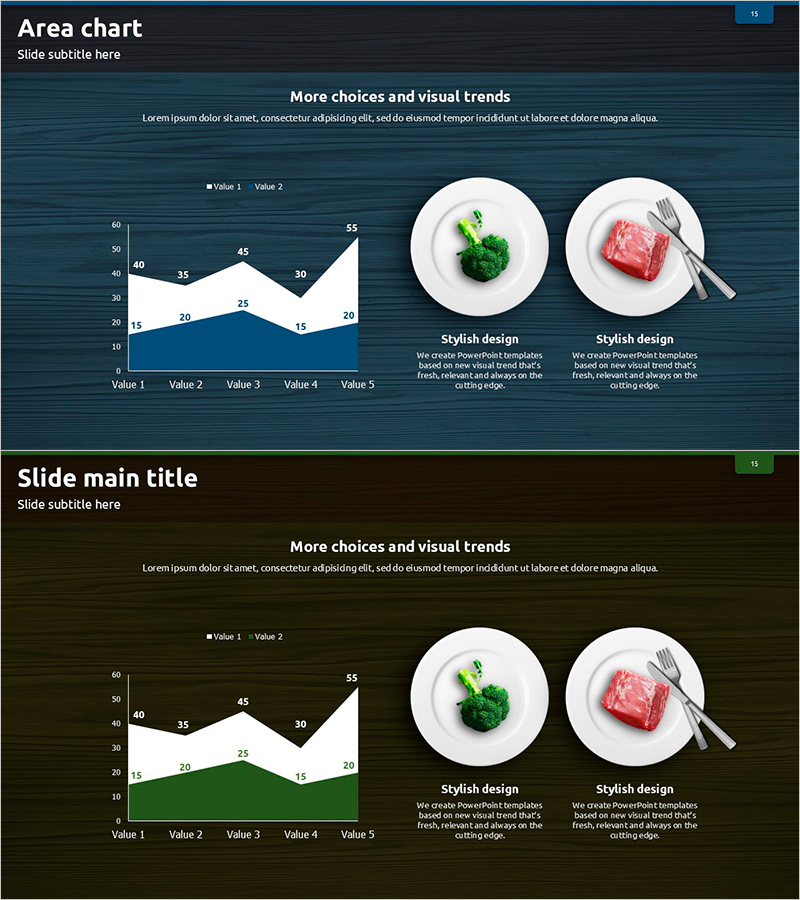
A professional area chart PowerPoint slide designed to visualize healthy food ingredient data and market trends. The dark blue background features white-outlined two-layer area charts that clearly show data progression across five data points. The right side includes circular food product images with descriptive text areas, enabling simultaneous presentation of quantitative metrics and qualitative insights. This 16:9 widescreen, 2-slide template is fully editable and ideal for market analysis presentations, product introductions, business reports, and competitive positioning documents.
Usage Points
-
Main Usage
Visualize multi-dimensional data trends over time—such as market growth, product performance, or consumer preference shifts—using stacked area charts to support data-driven decision-making in business reports and investor presentations.
-
How to Use
Replace the sample data in the left-side area chart with your actual figures, update the legend and value labels, and insert relevant product images or visuals in the right-side image areas. Customize text descriptions to match your presentation context and export as needed.
-
Recommended For
Food and beverage industry professionals, marketing and sales teams presenting market analysis, investors reviewing business performance, product managers conducting competitive analysis, and executives preparing quarterly or annual business reports.
-
Slide Structure
Two-slide layout. Each slide features a two-layer area chart on the left displaying five data points with value labels, and a right-side section containing two circular image placeholders with accompanying text blocks for contextual information and insights.
Related Products
-

Product Sales Status Chart – Effective Data Visualization
#Business Strategy #Market and Competitor Analysis #Diagram
-

Customer Reviews and Feedback on Travel Guides – Market Share Insights
#Market and Competitor Analysis #Graph #Other
-

Performance and Future Prospects Green Navy – Business Strategy through Data Visualization
#Company Introduction #Business Strategy #Graph
-

Game Service Operation and Product Sales Performance – Data Visualization
#Company Introduction #Business Strategy #Graph
