Current Trends and Issues Analysis Chart – Market and Competitor Analysis
RM0900002_8
- Last Update 03/02/2025
- File Size 0.4MB
- # of Slides 2
- File Format PPTX
- Slide Ratio 16:9
- Color
Keywords
- #Content-Based Slides
- #Design-Based Slides
- #Market and Competitor Analysis
- #Diagram
- #Graph
- #Market Analysis
- #Cluster
- #Column
- #Closed Cluster Diagram
- #Grouped Column
- #16:9
- #grouped bar chart PowerPoint
- #trend comparison slide template
- #market analysis chart
- #competitor analysis PowerPoint
- #data visualization slides
- #comparative analysis template
About the Product
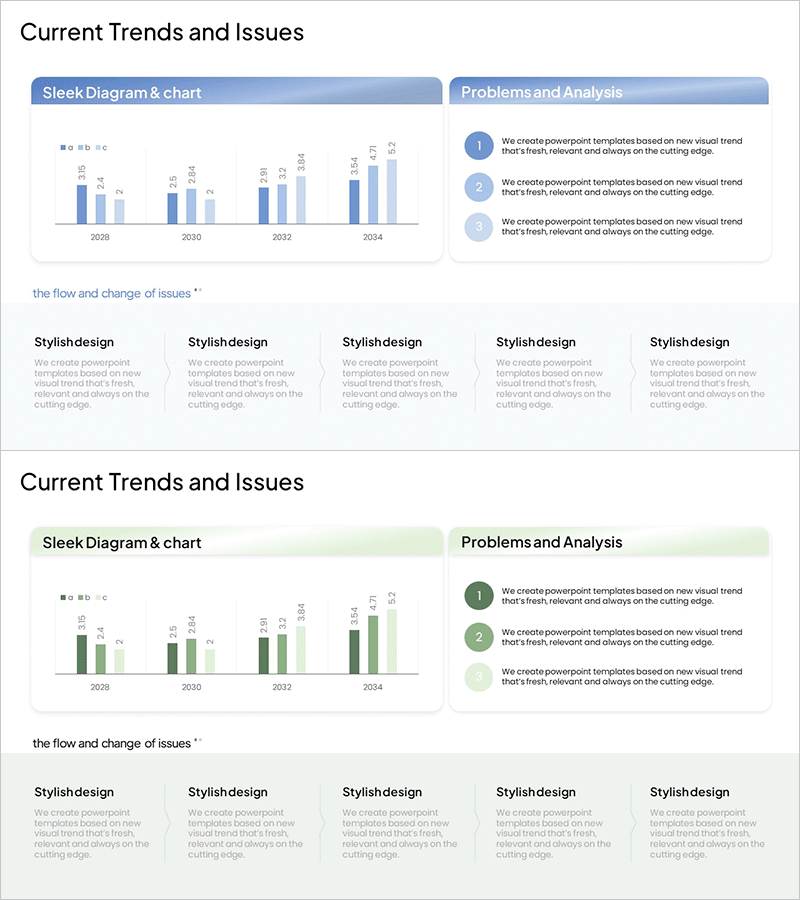
A 2-slide PowerPoint presentation for analyzing current trends and market issues through visual data comparison. Features grouped bar charts in blue and green tones displaying 4-year market changes from 2028 to 2034, with a chart section on the left and analysis points on the right. Each slide includes a problems and analysis section paired with 5 styled text boxes for highlighting key insights. Ready to use in business reports, presentations, and strategic planning documents to support data-driven decision-making.
Usage Points
-
Main Usage
Compares numerical data across years and categories using grouped bars to display market trends and competitive landscape at a glance. Ideal for business reports, marketing plans, and investor presentations requiring quantitative evidence.
-
How to Use
Input actual data in the left chart area and adjust bar heights and colors accordingly. Add key interpretations in the right analysis section. Reuse both slides for sequential analysis of multiple metrics or modify colors to compare different scenarios.
-
Recommended For
Executives, planning teams, marketing departments, and sales teams presenting quarterly or annual performance analysis, market research findings, and competitive benchmarking. Particularly suited for decision-making meetings and external presentations requiring quantitative support.
-
Slide Structure
Slide 1: Blue-toned grouped bar chart (4 years × 3 series) with 3 numbered circular analysis points on right / Slide 2: Green-toned identical structure with 3 numbered points. Both slides include 5 styled text boxes at bottom for additional explanations.
Related Products
-

Analysis of Online Learning Data Slide
#Market and Competitor Analysis #Diagram #Graph
-

Bio Industry Status Analysis Chart
#Company Introduction #Market and Competitor Analysis #Diagram
-

Experimental Results Analysis Vertical Bar Graph – Incorporating Visual Trends
#Market and Competitor Analysis #Diagram #Graph
-

Business Plan Competitor Analysis Chart – Effective Market Analysis Tool
#Market and Competitor Analysis #Diagram #Graph
