Business Plan Competitor Analysis Chart – Effective Market Analysis Tool
RM0100020_6
- Last Update 01/31/2025
- File Size 16.8MB
- # of Slides 2
- File Format PPTX
- Slide Ratio 16:9
- Color
Keywords
- #Content-Based Slides
- #Design-Based Slides
- #Market and Competitor Analysis
- #Diagram
- #Graph
- #Competitor Analysis
- #Market Analysis
- #Cluster
- #Column
- #Closed Cluster Diagram
- #Grouped Column
- #16:9
- #competitor analysis chart PowerPoint
- #grouped bar graph presentation
- #market analysis slides
- #comparison analysis PPT template
- #business plan charts
- #data visualization slides
About the Product
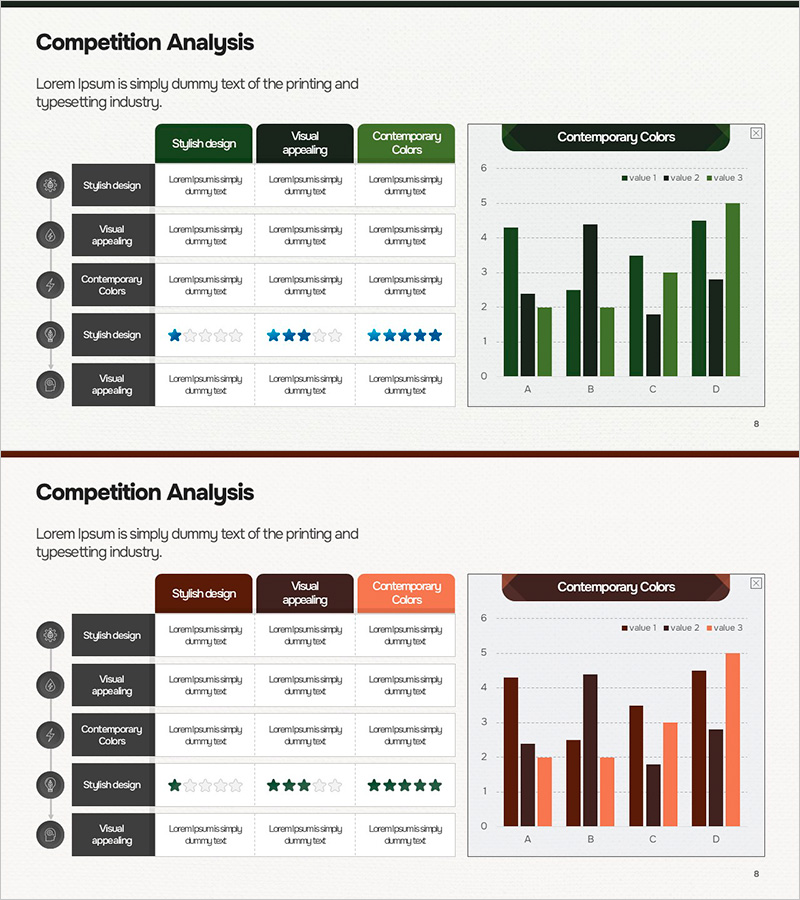
An essential PowerPoint slide set for business plans and marketing strategy presentations featuring competitor analysis visualization. This two-slide deck combines a table-format comparison matrix with a horizontal bar chart, enabling effective market analysis data presentation. The dark green and white color scheme enhances information clarity, allowing simultaneous comparison of four competitors (A, B, C, D) across three evaluation dimensions: stylish design, visual appeal, and contemporary colors. Delivered in 2 slides with 16:9 widescreen format, optimized for modern projectors and digital presentation environments.
Usage Points
-
Main Usage
Designed for the competitive analysis section of business plans and marketing presentations, enabling quantitative comparison of key competitors' strengths and weaknesses. Dual visualization formats—table and graph—enhance audience comprehension and strengthen presentation persuasiveness.
-
How to Use
Enter competitor scores in the table section for each evaluation criterion (design style, visual appeal, color scheme), and the horizontal bar chart automatically updates to visualize comparative results. Colors and values are fully editable; additional competitors or evaluation metrics can be accommodated by expanding rows and columns.
-
Recommended For
Startup founders, new business planning teams, marketing professionals, consultants, and MBA students preparing business plans, marketing strategies, or investor pitch decks who need to communicate competitive landscape analysis objectively and clearly.
-
Slide Structure
Slide 1: Table-format comparison matrix (5 rows × 4 columns structure with competitors A, B, C, D and 3 evaluation criteria; dark gray header with white data cells). Slide 2: Horizontal bar chart (4 competitors across 3 data series displayed in dark green, medium green, light green; Y-axis scale 0–6; legend included).
Related Products
-

Clustered Vertical Bar Graph Slide – Visualizing Market Analysis
#Market and Competitor Analysis #Diagram #Graph
-

VR Market Analysis Bar Graph
#Market and Competitor Analysis #Diagram #Graph
-

Business Area Analysis Graph – Suitable for Market and Competitive Analysis
#Market and Competitor Analysis #Diagram #Graph
-

Competitor Comparison Analysis Bar Graph – Data Visualization for Market Analysis
#Market and Competitor Analysis #Diagram #Graph
