User Analysis Graph by Age Group – Advanced Data Insights
RM0100011_13
- Last Update 01/28/2025
- File Size 1MB
- # of Slides 2
- File Format PPTX
- Slide Ratio 16:9
- Color
Keywords
- #Content-Based Slides
- #Design-Based Slides
- #Market and Competitor Analysis
- #Diagram
- #Graph
- #Customer Analysis
- #Market Analysis
- #Cluster
- #Column
- #Closed Cluster Diagram
- #Grouped Column
- #16:9
- #clustered bar chart PowerPoint
- #user analysis by age group slide
- #multi-series chart template
- #customer demographic visualization
- #market analysis graph PowerPoint
About the Product
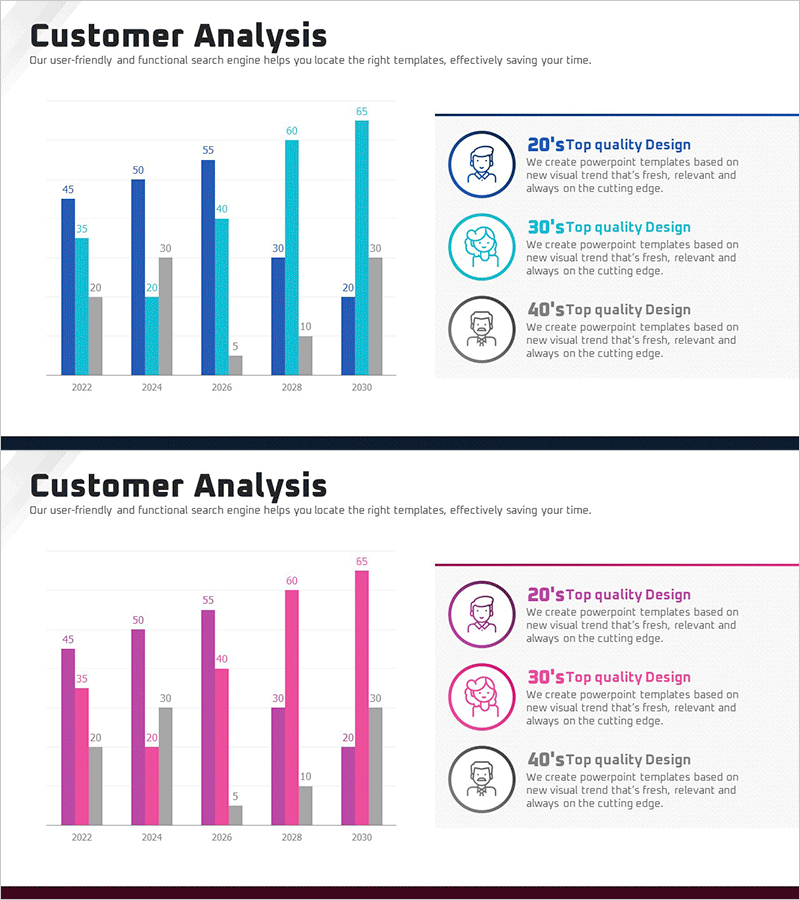
A clustered bar chart PowerPoint slide for visualizing user analysis data across age groups over time. This presentation template displays five years of data (2022–2030) across three age demographic series, with bars grouped by year to enable simultaneous comparison of trends and age-based differences. The navy, light blue, and gray color palette clearly distinguishes data series, while icon-based legend annotations on the right side ensure immediate usability in reports and presentations. Formatted in 16:9 widescreen across two slides, this template fits seamlessly into customer analysis, market analysis, and user statistics sections of business decks.
Usage Points
-
Main Usage
Express user distribution across age groups and temporal trends simultaneously through data visualization. Ideal for marketing reports, business analysis presentations, and customer segmentation talks that require multi-series comparative analysis.
-
How to Use
Each year group contains three bars representing age demographics (20s, 30s, 40s, etc.). Input your actual data, adjust bar heights and colors accordingly, and modify the legend icons and labels to match your presentation context. Add title and subtitle to customize for your specific audience.
-
Recommended For
Marketing teams presenting customer analysis reports, executive-level business performance presentations, market research institutions sharing statistical data, product planning teams analyzing user segmentation, and investor pitch decks highlighting market size trends.
-
Slide Structure
Slide 1: Title area + clustered bar chart with 5 years (2022–2030) × 3 age-group series + right-aligned icon legend (3 items). Slide 2: Identical layout with alternative color scheme (magenta, light pink, gray tones) for presentation variety and visual flexibility.
Related Products
-

Layout Design Presentation Template for Market & Competitor Analysis – Column Chart
#Market and Competitor Analysis #Graph #Customer Analysis
-

Clustered Vertical Bar Graph Slide – Visualizing Market Analysis
#Market and Competitor Analysis #Diagram #Graph
-

Bio Industry Status Analysis Chart
#Company Introduction #Market and Competitor Analysis #Diagram
-

Current Trends and Issues Analysis Chart – Market and Competitor Analysis
#Market and Competitor Analysis #Diagram #Graph
