Business Analysis Bar Graph – Business Strategy and Market Analysis
RJ0300056_7
- Last Update 05/03/2025
- File Size 4MB
- # of Slides 2
- File Format PPTX
- Slide Ratio 16:9
- Color
Keywords
- #Content-Based Slides
- #Design-Based Slides
- #Business Vision and Strategy
- #Market and Competitor Analysis
- #Diagram
- #Graph
- #Business Strategy
- #Market Analysis
- #Cluster
- #Column
- #Closed Cluster Diagram
- #Grouped Column
- #16:9
- #clustered column chart PowerPoint
- #data comparison slide template
- #business analysis chart
- #bar graph PPT
- #2-series chart download
About the Product
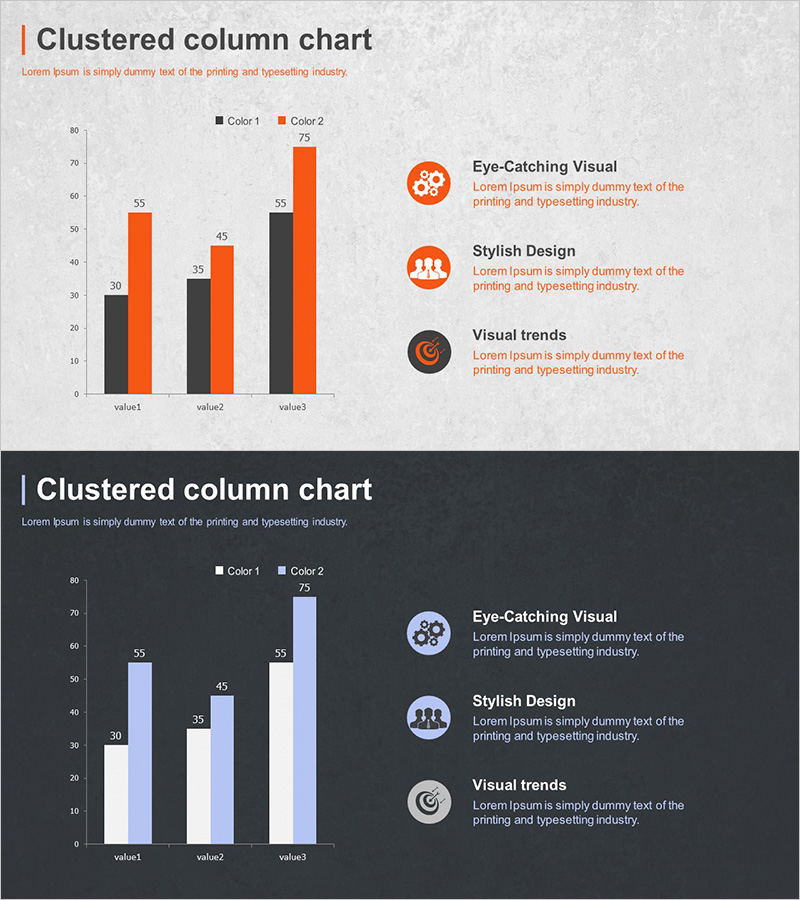
A clustered column chart PowerPoint slide designed for business strategy and market analysis presentations. The slide features a light gray background with black and orange data series, allowing side-by-side comparison of three data points. Precise numerical labels are displayed on each bar for clear data communication. Provided as a 16:9 widescreen 2-slide set, with fully editable colors and values for immediate use in reports and presentations.
Usage Points
-
Main Usage
Visualize comparative data across multiple categories in business strategy, market analysis, quarterly performance reviews, and competitive benchmarking. The dual-series format enables clear side-by-side comparison of metrics, making quantitative evidence immediately apparent to audiences.
-
How to Use
Open the slide, delete existing values, and input your data. Bar heights and colors adjust automatically. Modify legend labels and axis titles as needed. Insert directly into presentations, reports, and business proposals without additional formatting.
-
Recommended For
Ideal for executives, planning teams, marketing departments, and sales teams presenting quarterly results, market research findings, and competitive analysis. Recommended for any business presentation requiring objective quantitative data comparison.
-
Slide Structure
2-slide set. First slide: light gray background with black and orange clustered bars comparing 3 data points. Second slide: dark charcoal background with lavender and sky blue series in identical structure. Numerical labels on each bar, legend included, 16:9 aspect ratio.
Related Products
-

Mobile Service Analysis Graph – Visualizing Market Competitiveness
#Market and Competitor Analysis #Diagram #Graph
-

VR Market Analysis Bar Graph
#Market and Competitor Analysis #Diagram #Graph
-

Business Area Analysis Graph – Suitable for Market and Competitive Analysis
#Market and Competitor Analysis #Diagram #Graph
-

Current Trends and Issues Analysis Chart – Market and Competitor Analysis
#Market and Competitor Analysis #Diagram #Graph
