VR Market Analysis Bar Graph
RJ0400065_19
- Last Update 06/05/2025
- File Size 3.4MB
- # of Slides 2
- File Format PPTX
- Slide Ratio 16:9
- Color
Keywords
- #Content-Based Slides
- #Design-Based Slides
- #Market and Competitor Analysis
- #Diagram
- #Graph
- #Competitor Analysis
- #Market Analysis
- #Cluster
- #Column
- #Closed Cluster Diagram
- #Grouped Column
- #16:9
- #VR market analysis chart
- #horizontal bar graph PowerPoint
- #market analysis presentation slide
- #competitive comparison chart
- #bar chart template download
About the Product
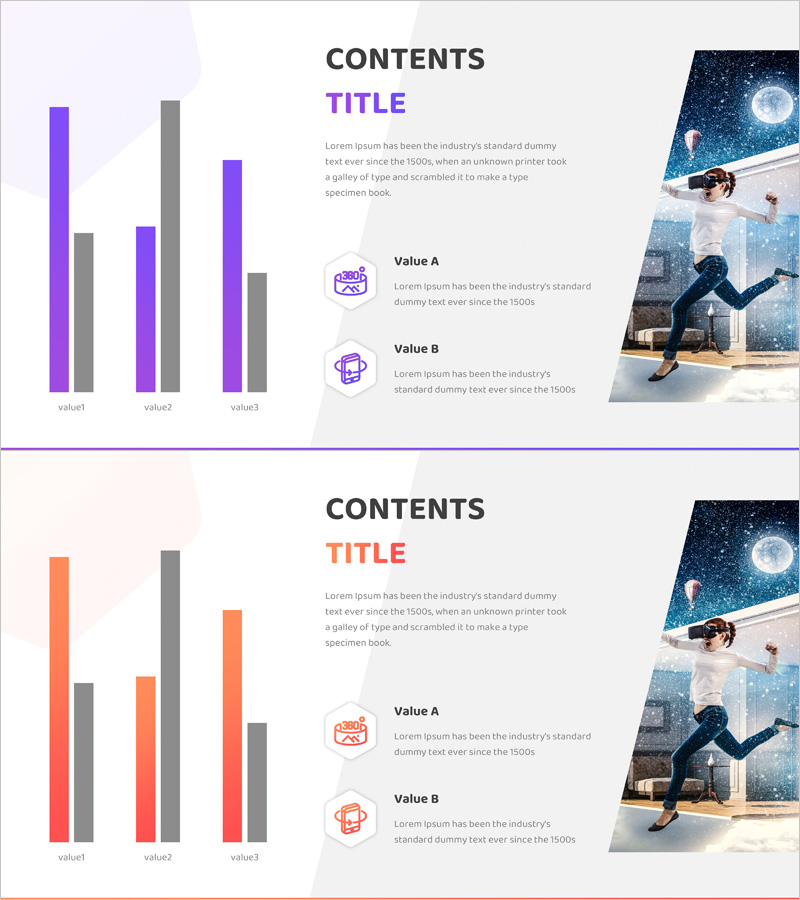
A horizontal bar chart PowerPoint slide optimized for VR market analysis and competitive comparison. This presentation template features a three-item comparison chart in purple and gray dual-tone colors, effectively visualizing market size, growth rate, and market share data. The 2-slide set provides identical layouts for consistent data presentation in 16:9 widescreen format. Clear separation between text and chart areas enables effective communication of presentation content alongside data visualization. Fully editable PPTX format allows immediate customization for your specific market analysis needs.
Usage Points
-
Main Usage
Compares three data items such as VR market size, growth rate, and market share using horizontal bar visualization. The purple and gray dual-tone color scheme distinguishes data series for enhanced visual clarity. Suitable for competitive analysis, market overview presentations, technology adoption rate comparisons, and various analytical scenarios requiring multi-item data comparison.
-
How to Use
Use in business plans, investor pitch decks, and market analysis reports within the market overview section to visualize numerical data. Bar length intuitively represents data magnitude, enabling quick comparison. Add analysis insights in the text area to strengthen your presentation narrative. The 2-slide set allows repeated use of identical layouts or adaptation for different datasets.
-
Recommended For
Ideal for VR/AR/metaverse industry presentations, technology market research reports, new business strategy pitches, and investor relations materials. Recommended for strategy planning teams, marketing departments, business development teams, and consulting analysts presenting market data to stakeholders.
-
Slide Structure
2-slide set with identical layout. Each slide features a horizontal bar chart (3 items, purple-gray dual-tone) on the left, text area (title, description, Value A, Value B) on the right, and image area in upper right corner. 16:9 widescreen format, fully editable PPTX with all elements customizable.
Related Products
-

Business Plan Competitor Analysis Chart – Effective Market Analysis Tool
#Market and Competitor Analysis #Diagram #Graph
-

Experimental Results Analysis Vertical Bar Graph – Incorporating Visual Trends
#Market and Competitor Analysis #Diagram #Graph
-

Business Area Analysis Graph – Suitable for Market and Competitive Analysis
#Market and Competitor Analysis #Diagram #Graph
-

Clustered Vertical Bar Graph Slide – Visualizing Market Analysis
#Market and Competitor Analysis #Diagram #Graph
