National Breakdown of Natural Energy Resources
RB0100011_8
- Last Update 03/02/2025
- File Size 0.5MB
- # of Slides 2
- File Format PPTX
- Slide Ratio 4:3
- Color
Keywords
- #Content-Based Slides
- #Design-Based Slides
- #Market and Competitor Analysis
- #Corporate Social Responsibility
- #Graph
- #Other
- #Market Status
- #ESG
- #Map
- #4:3
- #global energy resources map PowerPoint
- #country energy distribution slide
- #natural energy presentation template
- #map-based data visualization slide
- #ESG energy report PowerPoint
About the Product
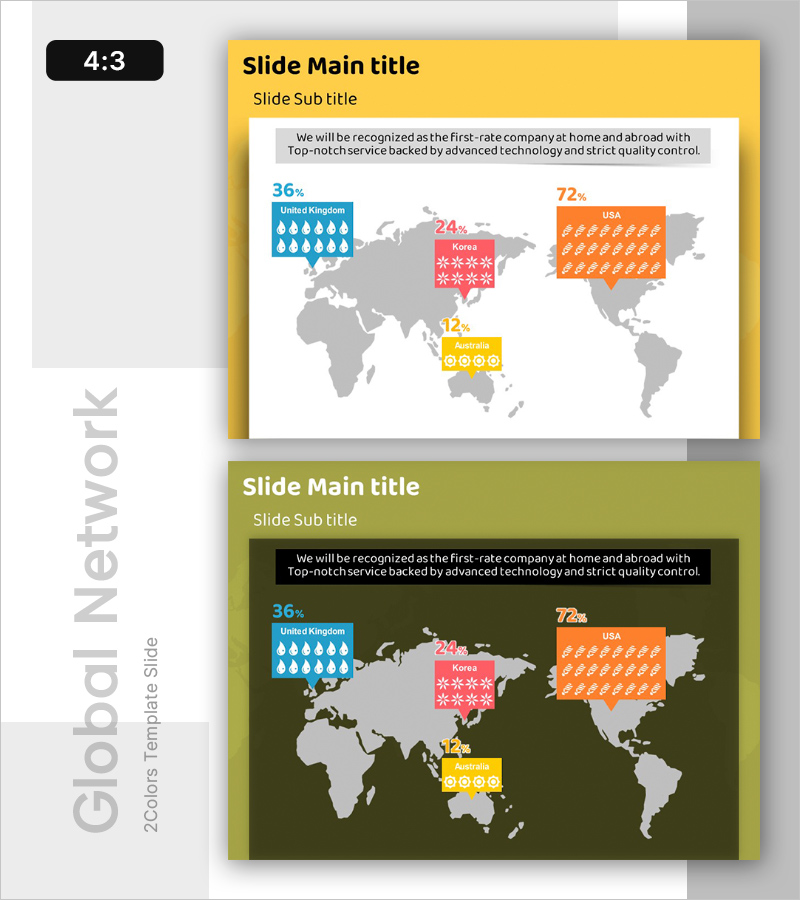
A PowerPoint slide visualizing natural energy resource distribution across countries using a world map. Four nations (United Kingdom, USA, Korea, Australia) are highlighted with percentages and icon patterns in yellow, blue, pink, and orange. The slide combines a text description area with map-based data visualization, making it immediately applicable to ESG reports, energy industry presentations, and market analysis materials. Includes two versions with light and dark backgrounds for flexible presentation environments.
Usage Points
-
Main Usage
This slide is designed to present global energy resource distribution across countries at a glance. The map-based visualization conveys regional energy supply rates intuitively, while percentage figures and icon patterns enhance data readability. Ideal for ESG management reporting, energy industry strategy presentations, and sustainability-focused meetings where clear data communication is essential.
-
How to Use
Enter your company vision or objectives in the text box, then replace country names, percentages, and icons with your own data. You can maintain the color scheme or change it to match your corporate brand colors. Add additional countries or represent time-based changes as needed. Choose between light or dark background versions depending on your presentation venue and projector setup.
-
Recommended For
Suitable for energy and utility company executive briefings, sustainability officer ESG disclosure presentations, investor relations (IR) meetings explaining global business status, government and public sector energy policy announcements, and consulting firm market analysis reports. The map-based layout enables effective data communication in international conferences and English-language presentations without language barriers.
-
Slide Structure
The slide features a three-section layout: title and subtitle area at the top, text description box in the center, and world map area at the bottom. Four countries are highlighted on the map with distinct colors, each displaying percentage figures, country names, and icon patterns (water drops, stars, circles, etc.). Contains 2 text input areas and 4 data elements for a total of 6 editable components, enabling flexible customization.
Related Products
-

Target Country Market Analysis Graph
#Market and Competitor Analysis #Graph #Other
-

Fantastic Wide PowerPoint Map & Bar Chart
#Company Introduction #Market and Competitor Analysis #Graph
-

Meat and Vegetable Consumption by Region – Market Status Analysis
#Market and Competitor Analysis #Graph #Other
-

Regional Analysis of Retiree Lifestyle & Environment – Market Status Visualization
#Market and Competitor Analysis #Graph #Other
