Global Energy Icon Template – Modern and Stylish Design
B0100011
- Last Update 12/29/2024
- File Size 2.6MB
- # of Slides 21
- File Format PPTX
- Slide Ratio 4:3
- Color
Slide Preview

Keywords
About the Product
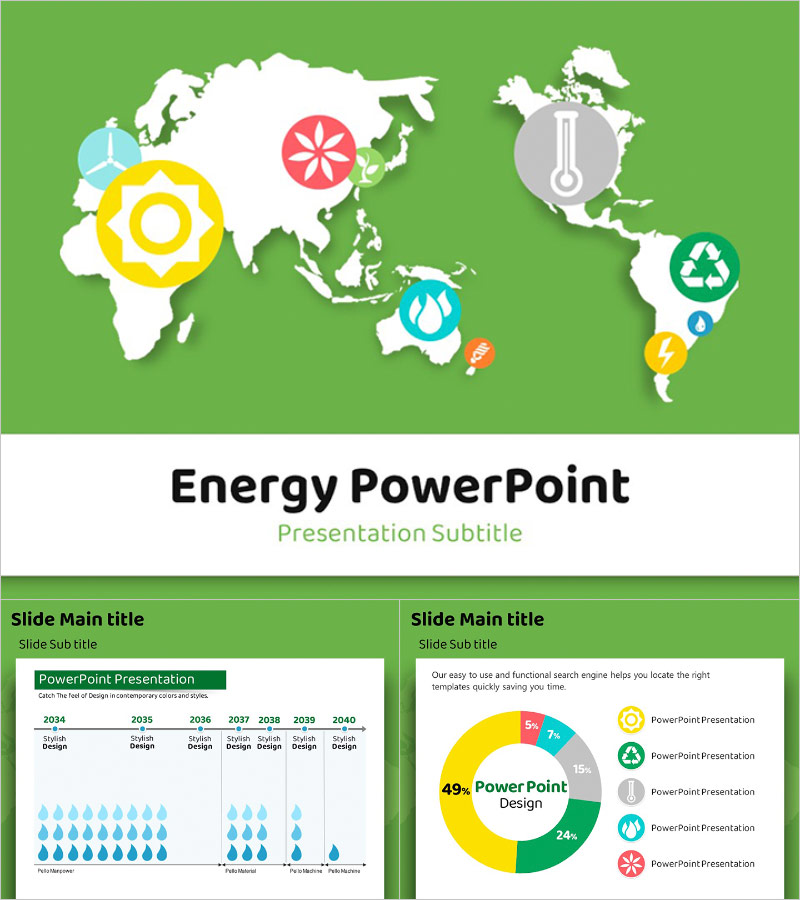
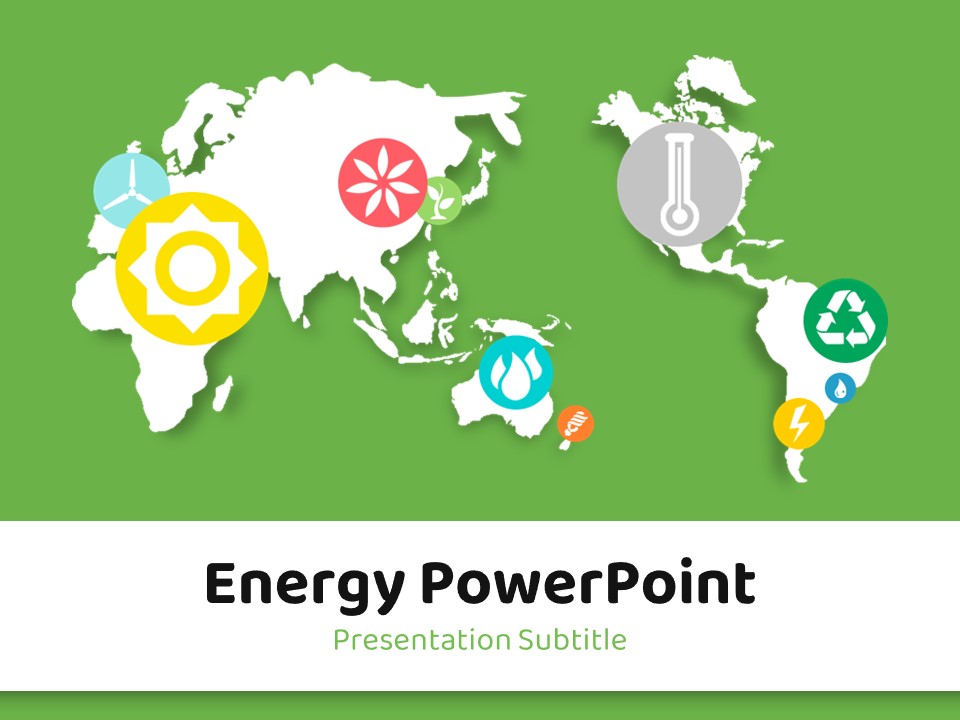
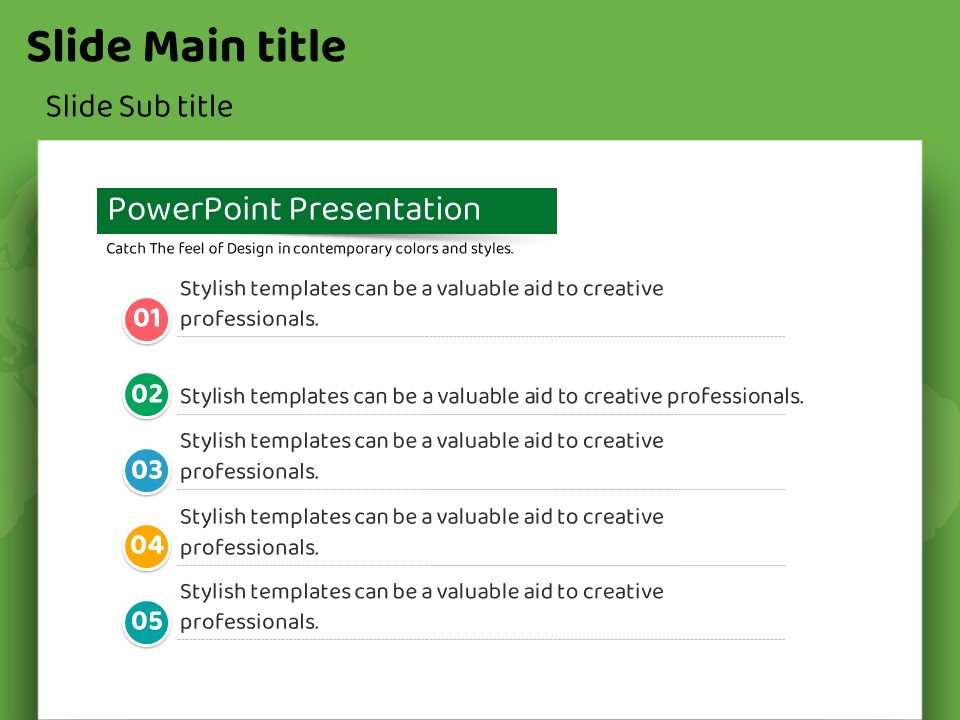
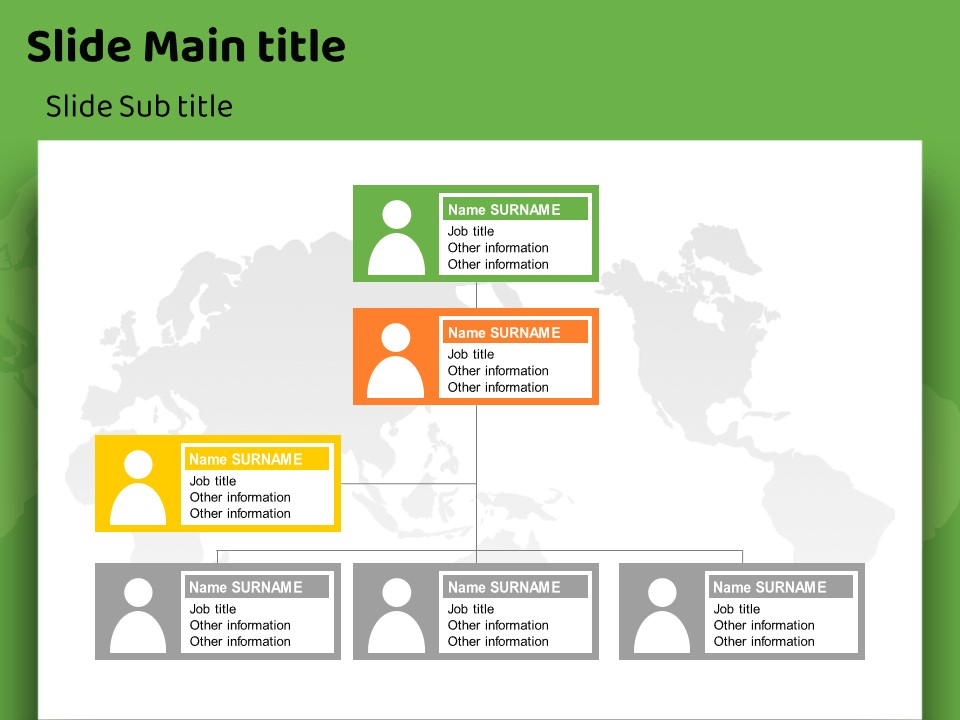
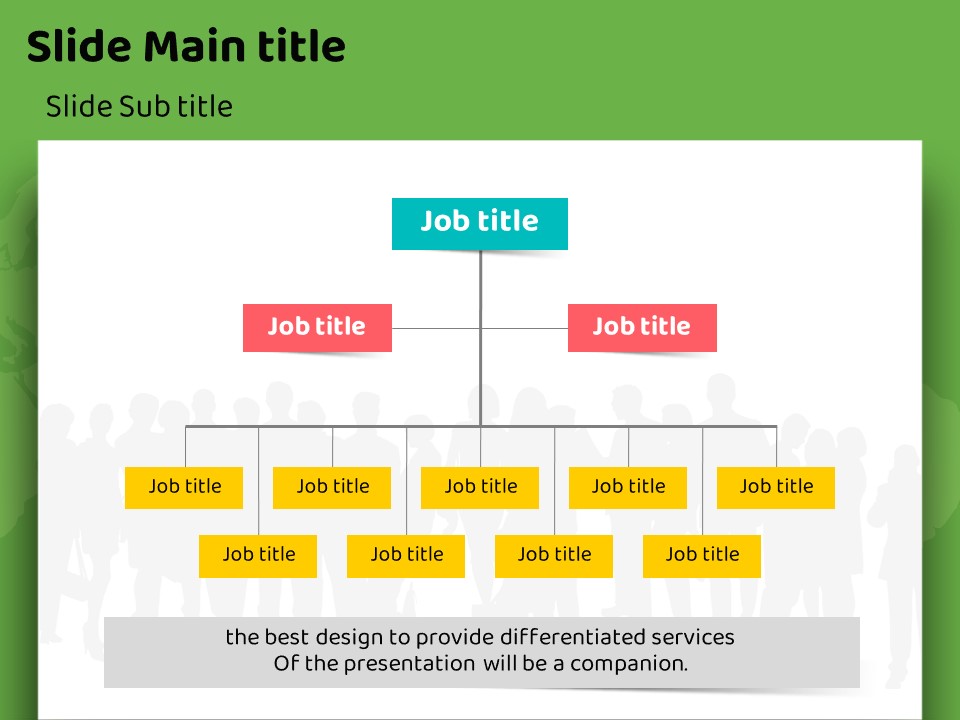
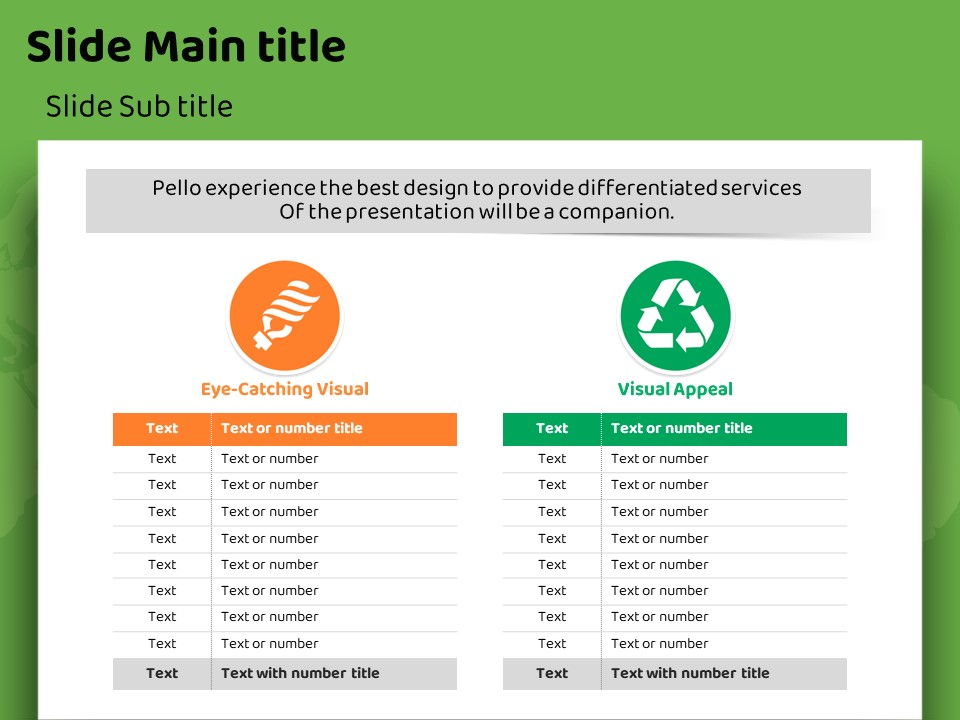
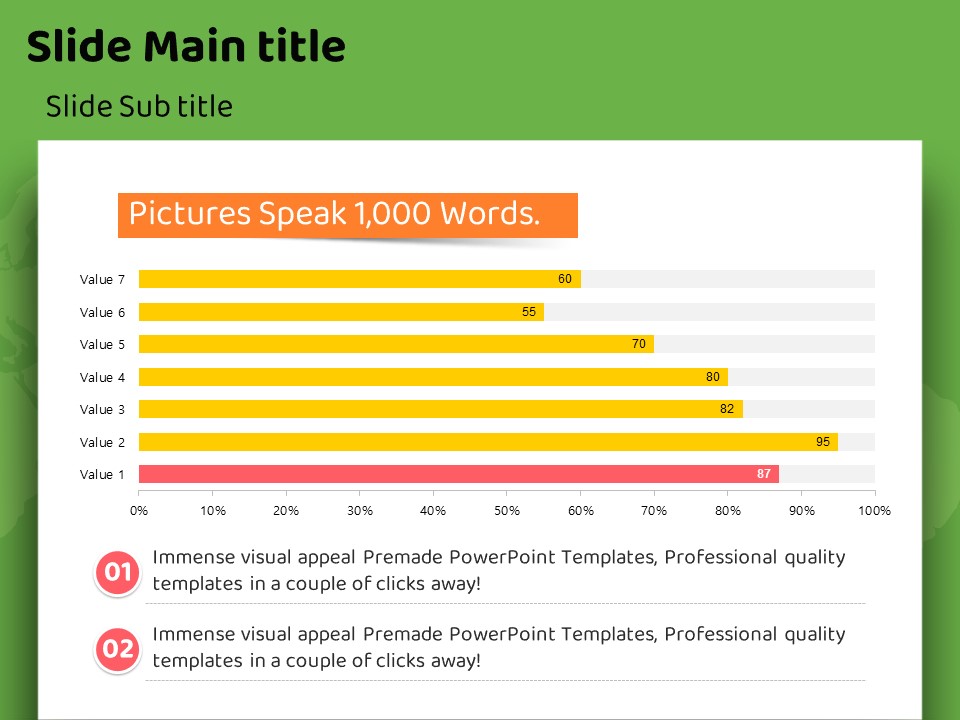
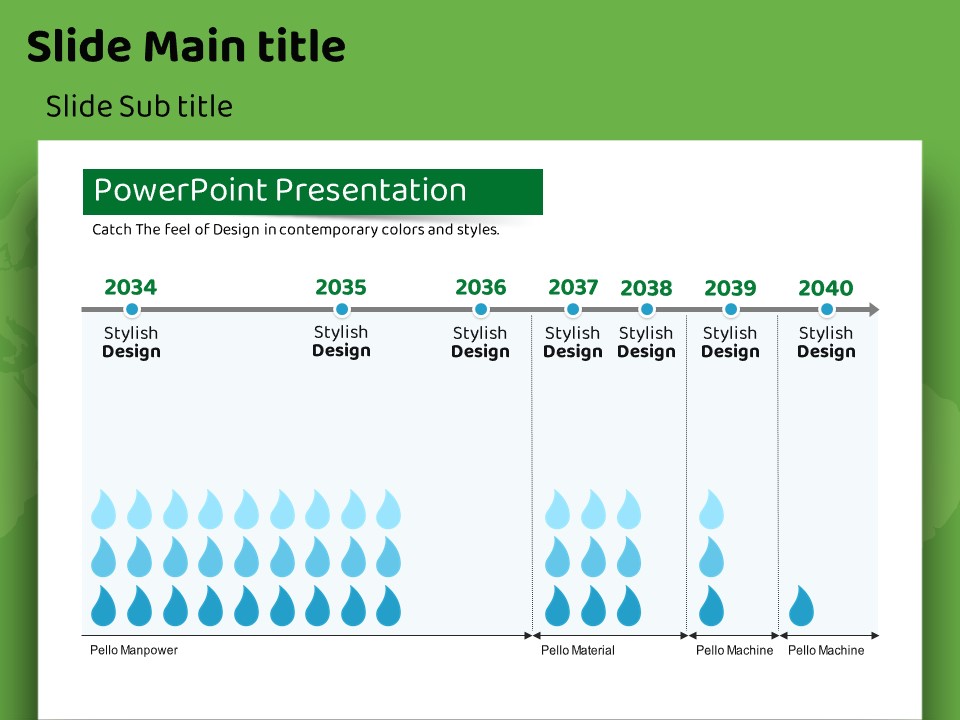
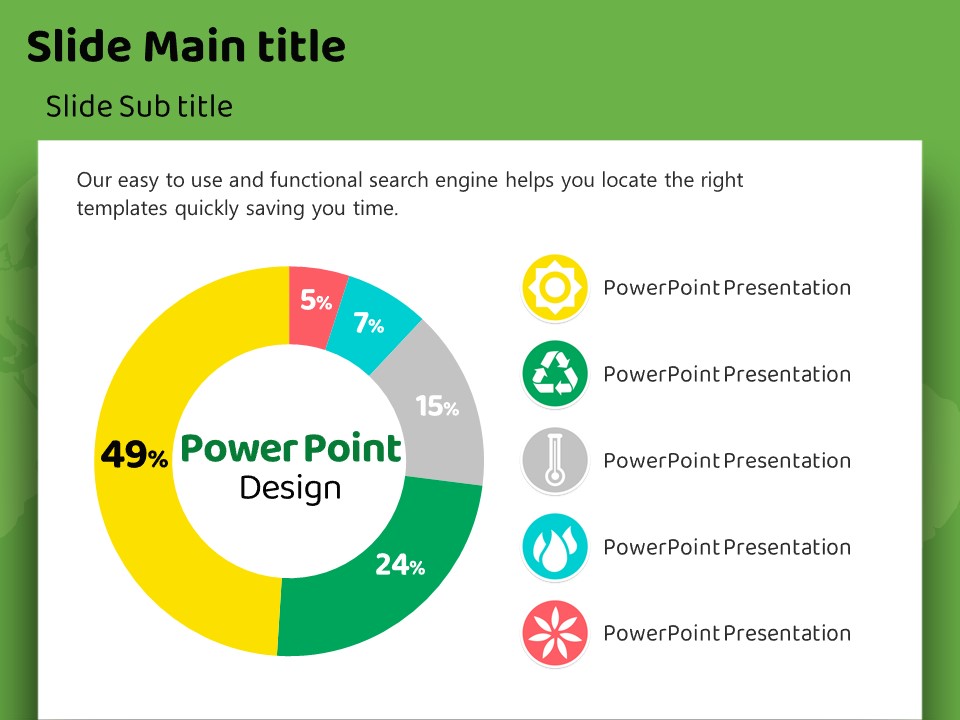
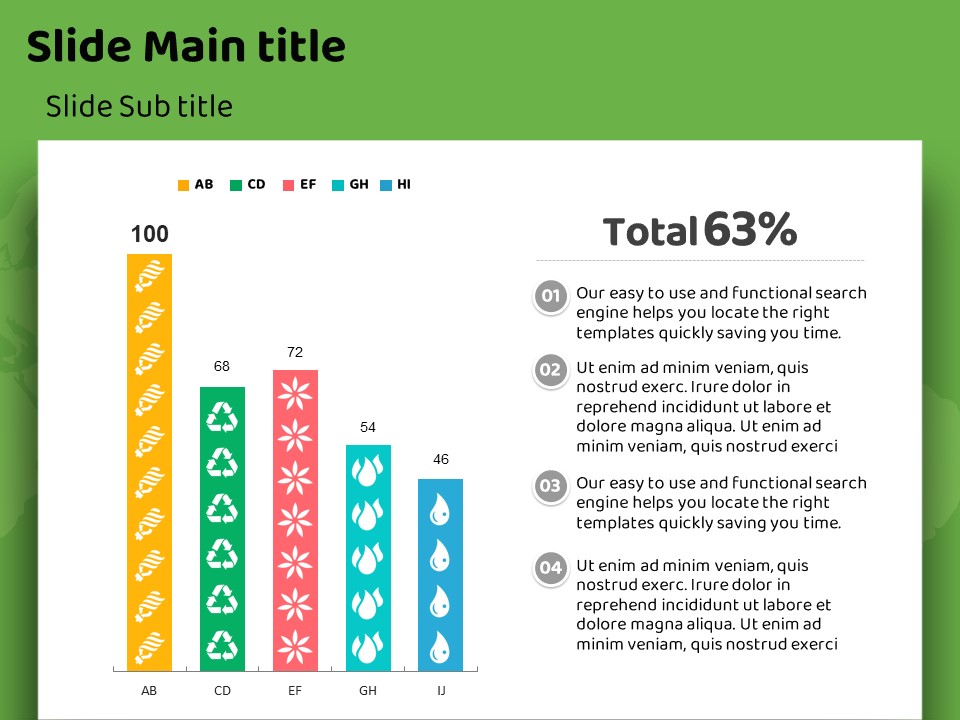
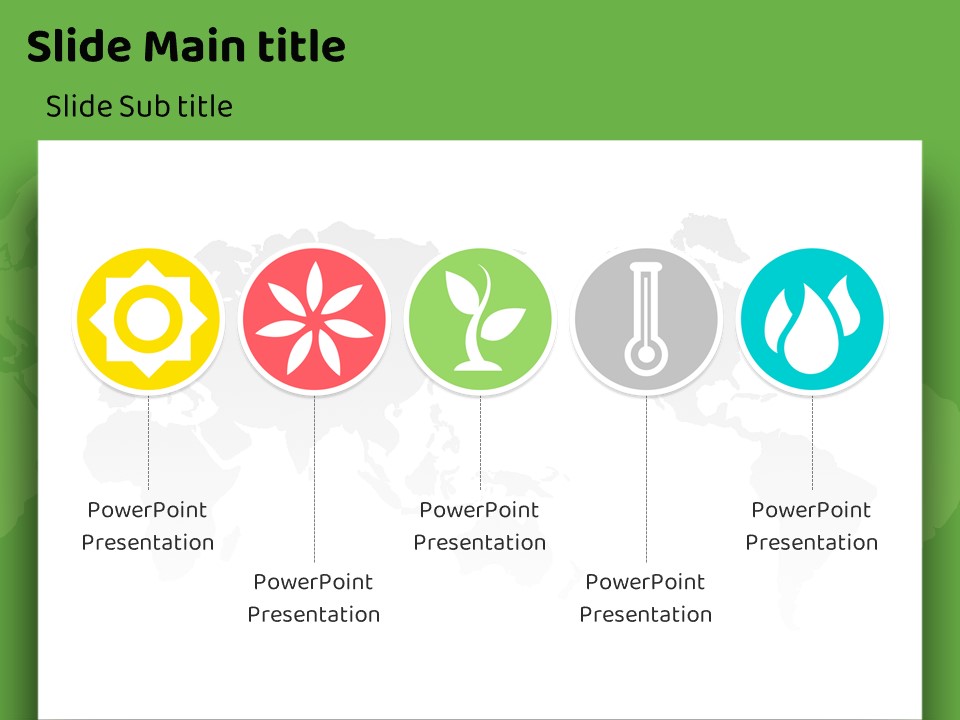
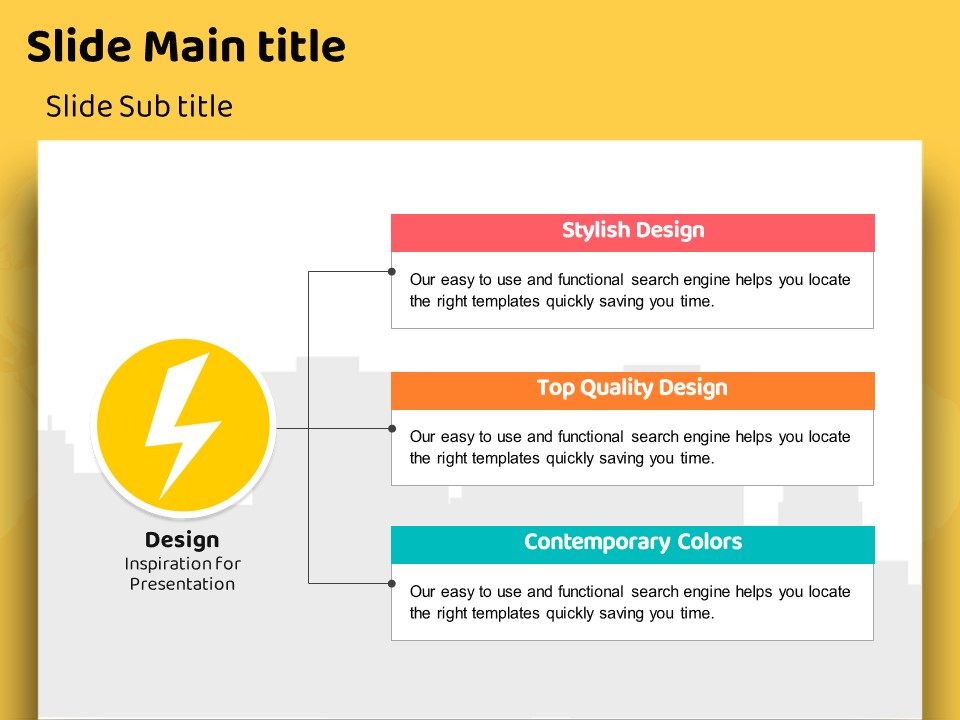
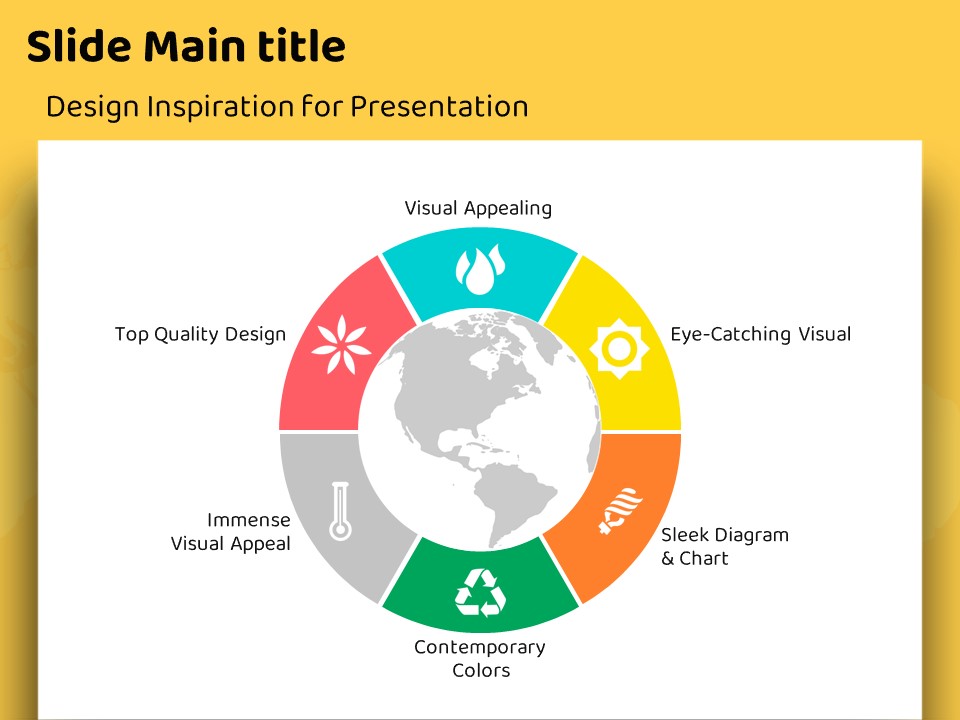
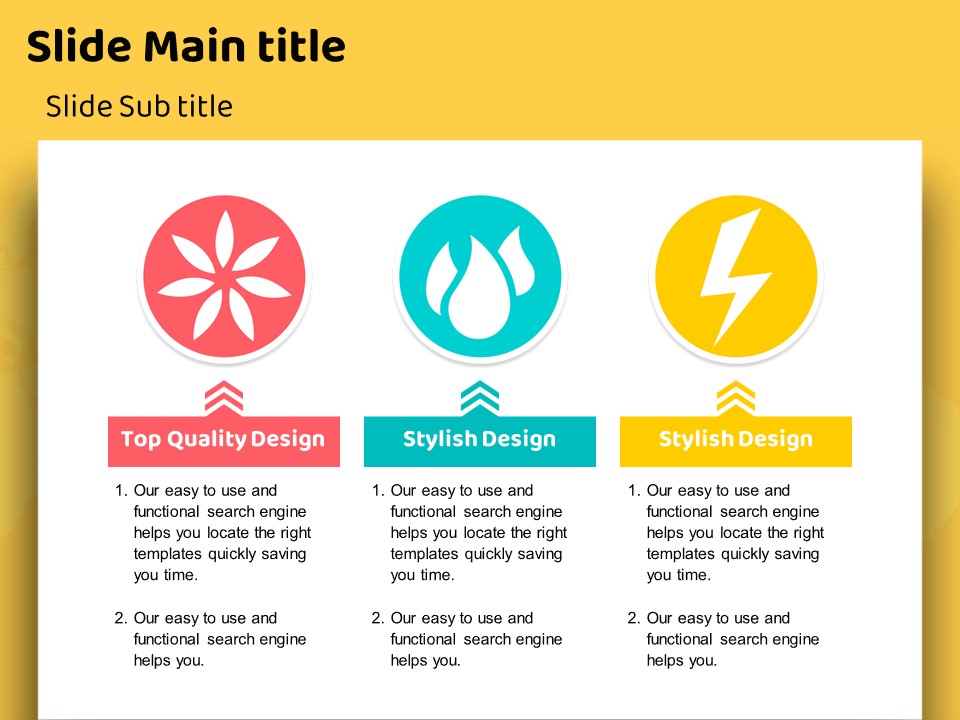
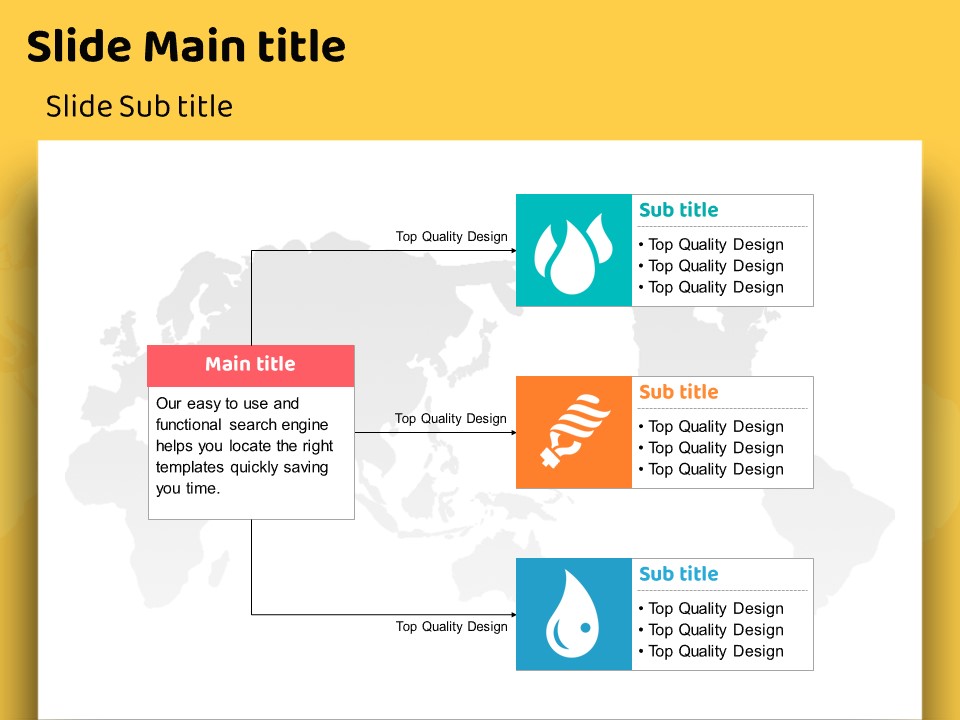
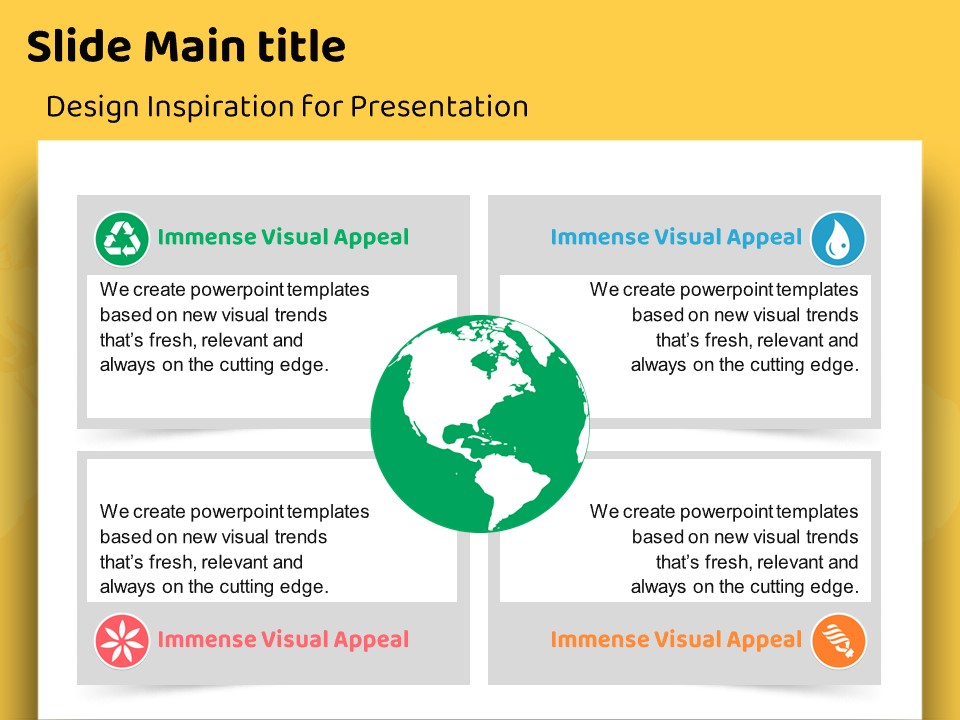
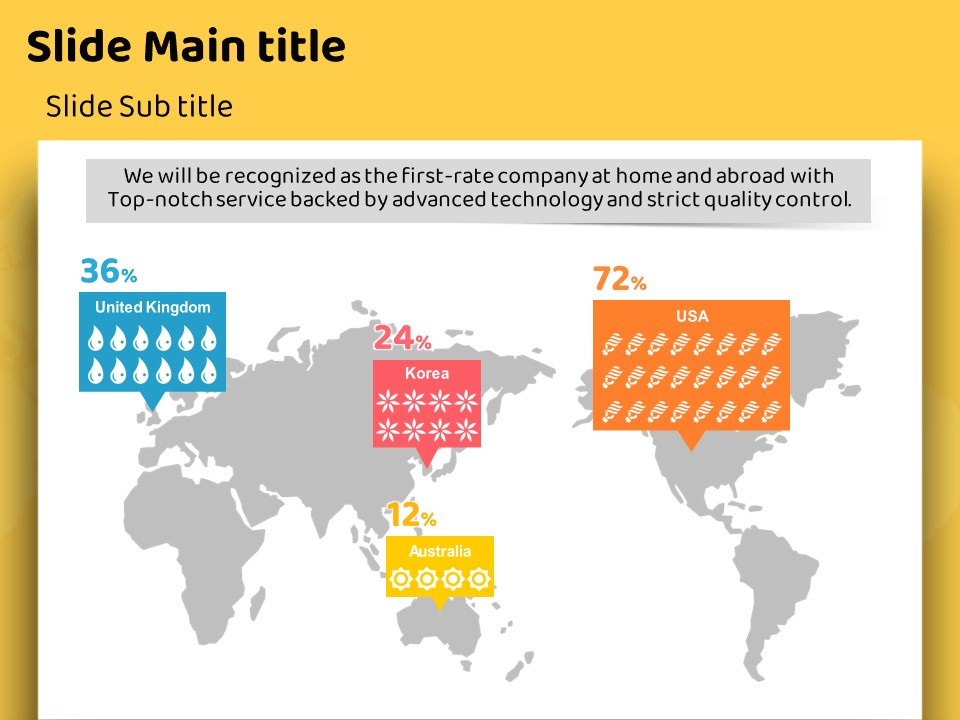
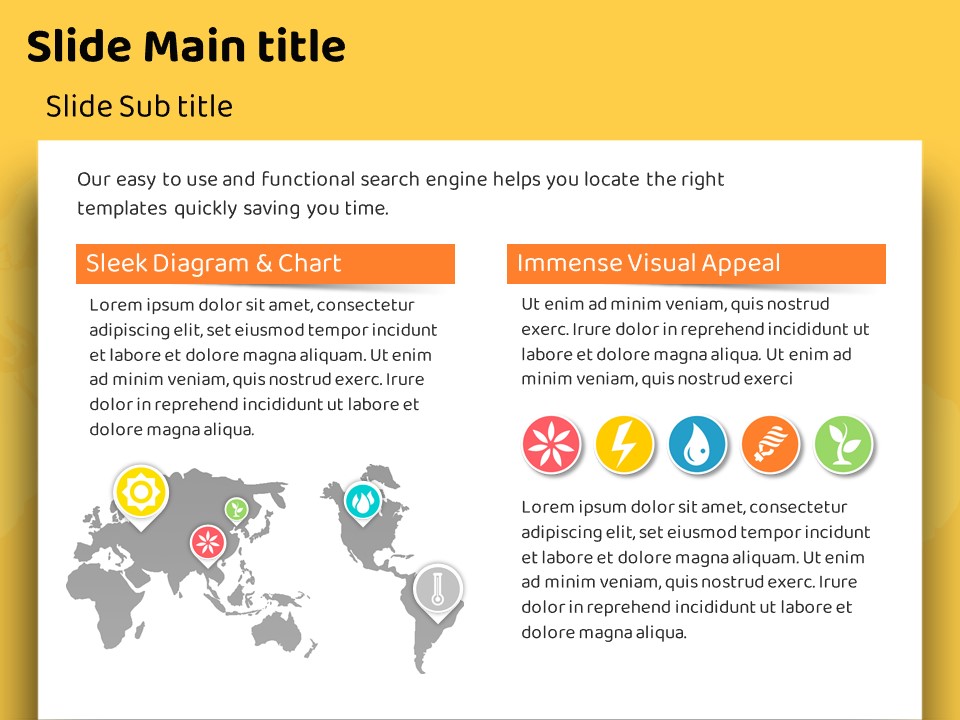
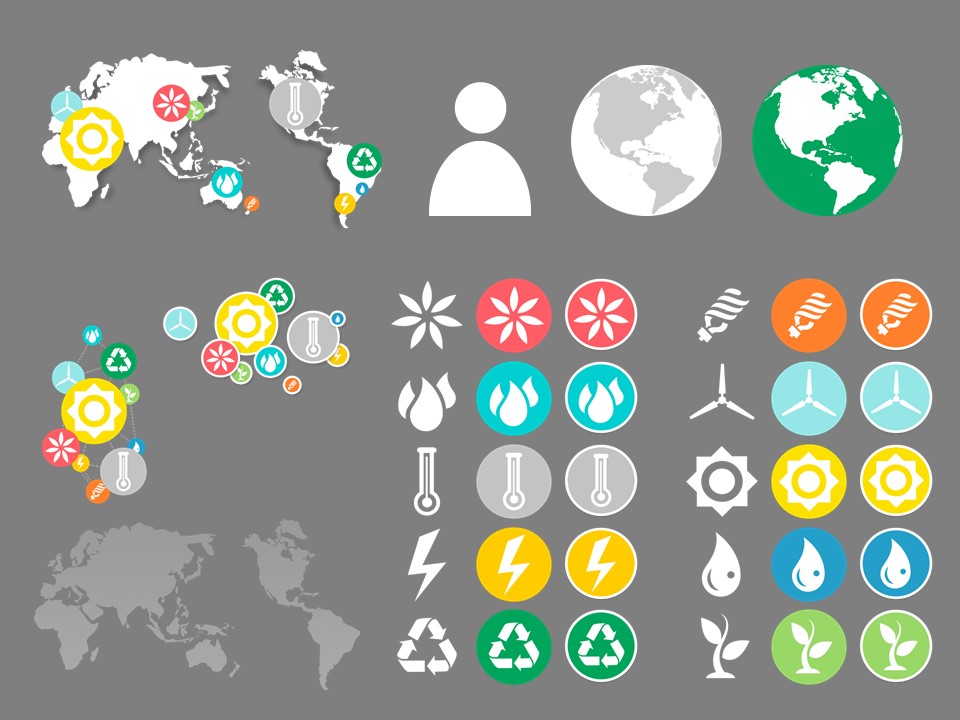
This PowerPoint template features a vivid green background with a white world map silhouette and multicolor energy icons representing solar, wind, recycling, water, and lightning energy types. Designed for global presentations in the energy, environment, and sustainability sectors, the set includes 21 fully editable slides in 4:3 ratio PPTX format. The template includes donut chart slides for visualizing energy type ratios across five categories, as well as bar chart slides with numbered text boxes for detailed data breakdowns. Each slide uses color-coded icons as visual anchors, making it easy for audiences to distinguish between energy categories at a glance. Ideal for investor relations decks, environmental policy reports, and global market analysis presentations, this slide deck allows you to replace text and adjust colors to match your corporate brand without redesigning from scratch. Download and start editing immediately.
Usage Points
-
Main Usage
Designed for global business presentations in the energy, environment, and sustainability fields. The template helps presenters clearly communicate energy type distributions and global market data using icon-based infographic layouts across 21 slides.
-
How to Use
Keep the world map and icon layout on the cover slide, then replace the placeholder text with your own content. Update the donut chart percentages and bar graph values with your actual data, and adjust icon colors to align with your brand palette for a consistent look.
-
Recommended For
Recommended for energy company IR managers, environmental policy researchers, global market consultants, and ESG report authors. Also well-suited for international conference presentations and investor-facing pitch decks requiring clear data visualization.
-
Slide Structure
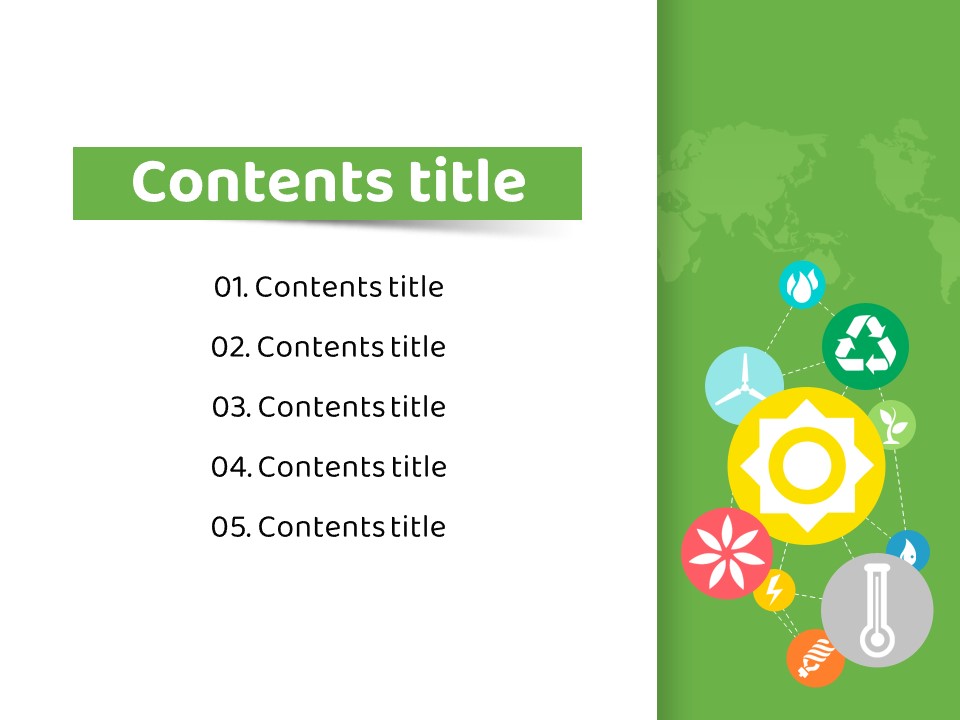
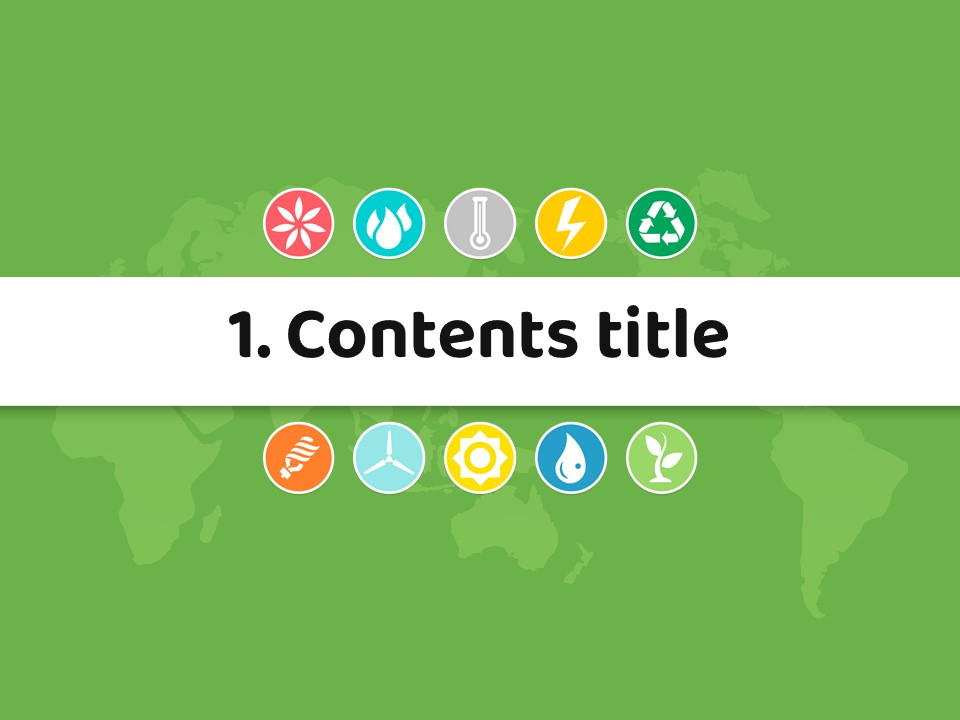
21 slides total: a green world map cover with multicolor energy icons, a donut chart slide showing five energy type ratios (49%, 24%, 15%, 7%, 5%), a five-category color bar chart slide with numbered text descriptions, and icon-legend text layout slides throughout.
Related Products
-

Container PPT Wide Template – Efficient Business Presentation Design
#Business
-

Illustrated Folder Presentation Template – Stylish and Practical Design
#Business
-

Ideas Conference Presentation Template – Stylish Business Design
#Business
-

Finance Presentation Template – Sleek and Modern Design
#Business
