Target Country Market Analysis Graph
RM0200003_7
- Last Update 02/01/2025
- File Size 3.2MB
- # of Slides 2
- File Format PPTX
- Slide Ratio 16:9
- Color
Keywords
- #Content-Based Slides
- #Design-Based Slides
- #Market and Competitor Analysis
- #Graph
- #Other
- #Market Status
- #Target Market
- #Horizontal Bar
- #Horizontal Bar Chart
- #Map
- #16:9
- #world map PowerPoint slide
- #regional market analysis presentation
- #global data visualization
- #horizontal bar chart template
- #international business slides
About the Product
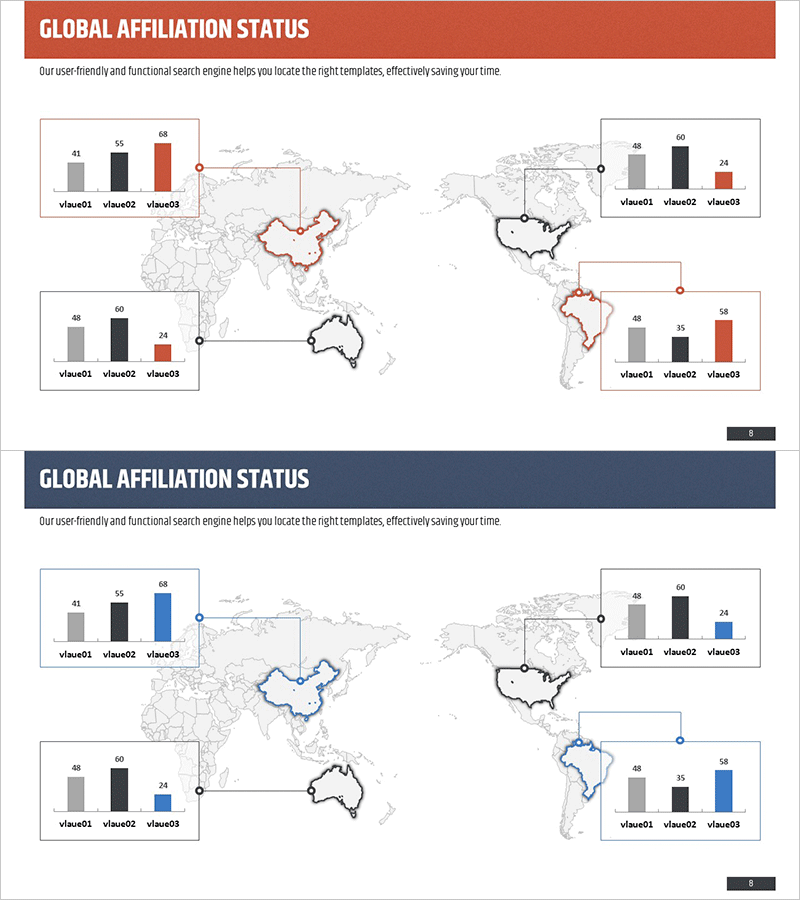
A PowerPoint slide that visualizes global market expansion strategy using a world map foundation. Four major regions—China, North America, Australia, and South America—are highlighted on the map, with horizontal bar charts displaying three data points (vvalue01, vvalue02, vvalue03) for each region. The design uses a three-color palette (gray, black, and orange or gray, black, and blue) to differentiate data series, with clear numerical labels in each regional box. Ideal for international business presentations, market research reports, and investor pitch decks to compare regional performance, market share, and growth rates at a glance. The 2-slide set offers multiple color themes that can be easily customized to match corporate branding.
Usage Points
-
Main Usage
Designed for global market expansion strategy, regional performance comparison, and international business data visualization. The slide highlights four key regions (China, North America, Australia, South America) on a world map and displays three metrics per region using horizontal bars to clearly communicate regional differences.
-
How to Use
Use in investor pitch decks, market research reports, and international business strategy presentations to compare regional market share, growth rates, and revenue figures. Replace bar values with actual data, and add or remove regions as needed to create customized analysis materials.
-
Recommended For
Recommended for global marketing managers, international business planners, executive reporting teams, international consultants, and import-export departments. Effective for multinational corporations analyzing regional performance, evaluating new market entry feasibility, and preparing international partnership negotiation materials.
-
Slide Structure
2-slide set. Each slide features a world map with 4 highlighted regions (China, North America, Australia, South America) and horizontal bar charts positioned beside each region showing 3 data points in a three-color scheme (gray, black, orange or gray, black, blue). Numerical labels and legend are included for immediate data input.
Related Products
-

Meat and Vegetable Consumption by Region – Market Status Analysis
#Market and Competitor Analysis #Graph #Other
-

Target Area Status Analysis Graph
#Market and Competitor Analysis #Marketing Plan and Strategy #Graph
-

City Map & Population Density Insights Slide – Market and Competitive Analysis
#Market and Competitor Analysis #Graph #Other
-

Horizontal Bar Chart for Accident Status Visualization – Optimizing Data Comparison
#Market and Competitor Analysis #Graph #Other
