Fantastic Wide PowerPoint Map & Bar Chart
RJ0200049_16
- Last Update 04/12/2025
- File Size 1MB
- # of Slides 2
- File Format PPTX
- Slide Ratio 16:9
- Color
Keywords
- #Content-Based Slides
- #Design-Based Slides
- #Company Introduction
- #Market and Competitor Analysis
- #Graph
- #Other
- #Global Network
- #Market Status
- #Column
- #Column Chart
- #Map
- #16:9
- #world map PowerPoint slide
- #global market analysis presentation
- #horizontal bar chart template
- #international business slides
- #geographic data visualization PowerPoint
About the Product
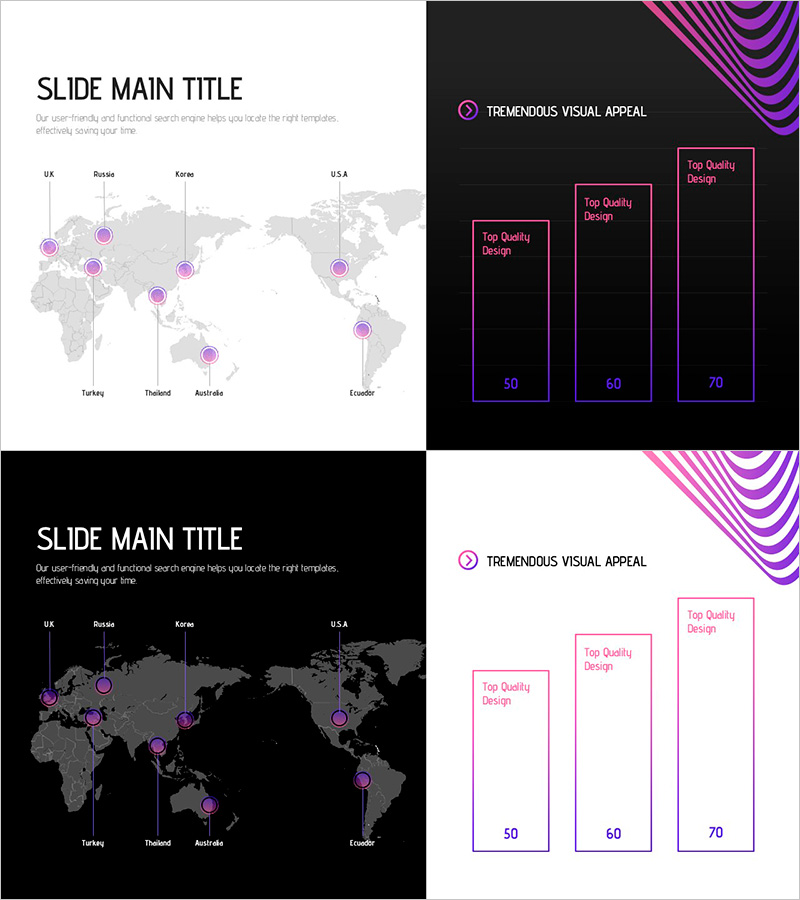
A comprehensive 2-slide PowerPoint set designed for global business presentations, combining an interactive world map with a comparative bar chart. The first slide features a world map with eight key countries (UK, Russia, Korea, USA, Turkey, Thailand, Australia, Ecuador) marked with pink circular icons, ideal for visualizing international market presence or global network expansion. The second slide displays a horizontal bar chart comparing three data points (50, 60, 70) with pink-to-blue gradient borders against a dark background, emphasizing data clarity and visual impact. Delivered in 16:9 widescreen PPTX format, fully editable and ready for immediate use in company overviews, market analysis presentations, and international business strategy discussions.
Usage Points
-
Main Usage
Effectively communicate global market conditions, country-by-country data comparisons, and international business strategies. The world map visualizes regional business presence, market distribution, or expansion footprint, while the horizontal bar chart compares quantitative metrics such as sales by country, market size, growth rates, or performance indicators across regions.
-
How to Use
Incorporate the world map slide in company overview sections to highlight global operational scope, and use the bar chart slide in market analysis or performance review sections to compare country-level metrics. Customize map marker positions and colors to emphasize specific regions, and update chart values and labels with your own data for immediate deployment in presentations.
-
Recommended For
Ideal for executives, marketing teams, and sales professionals at multinational corporations presenting global market insights. Suitable for international expansion strategies, cross-border partnership proposals, multi-country project reports, and any business presentation requiring geographic or comparative data analysis across nations.
-
Slide Structure
Slide 1: World map with 8 country markers (pink circular icons with country labels: UK, Russia, Korea, USA, Turkey, Thailand, Australia, Ecuador). Slide 2: Horizontal bar chart with 3 data series (50, 60, 70) featuring pink-to-blue gradient borders, dark background, and 'Top Quality Design' label. 16:9 widescreen format, black, white, pink, and blue color palette.
Related Products
-

Media Utilization Graph – Visualizing Market Trends
#Company Introduction #Market and Competitor Analysis #Other
-

Global Country Analysis Vertical Bar Graph – Market and Competitor Analysis
#Company Introduction #Market and Competitor Analysis #Graph
-

Global Market Entry & Data-Based Market Analysis Chart
#Company Introduction #Market and Competitor Analysis #Graph
-

Global Market Analysis Map – Importance of Market Connectivity
#Company Introduction #Market and Competitor Analysis #Graph
