Product Use Cases – Business Strategy Diagram Template
RM0700007_11
- Last Update 02/26/2025
- File Size 12.2MB
- # of Slides 2
- File Format PPTX
- Slide Ratio 16:9
- Color
Keywords
- #Content-Based Slides
- #Design-Based Slides
- #Slide Type
- #Business Strategy
- #Diagram
- #As-Is To-Be
- #Flow
- #Spread
- #Linear Flow
- #Centralized Diagram
- #Reference
- #16:9
- #Before-After diagram PowerPoint
- #business strategy presentation slide
- #comparison flow diagram
- #transformation visualization PPT
- #product use case template
About the Product
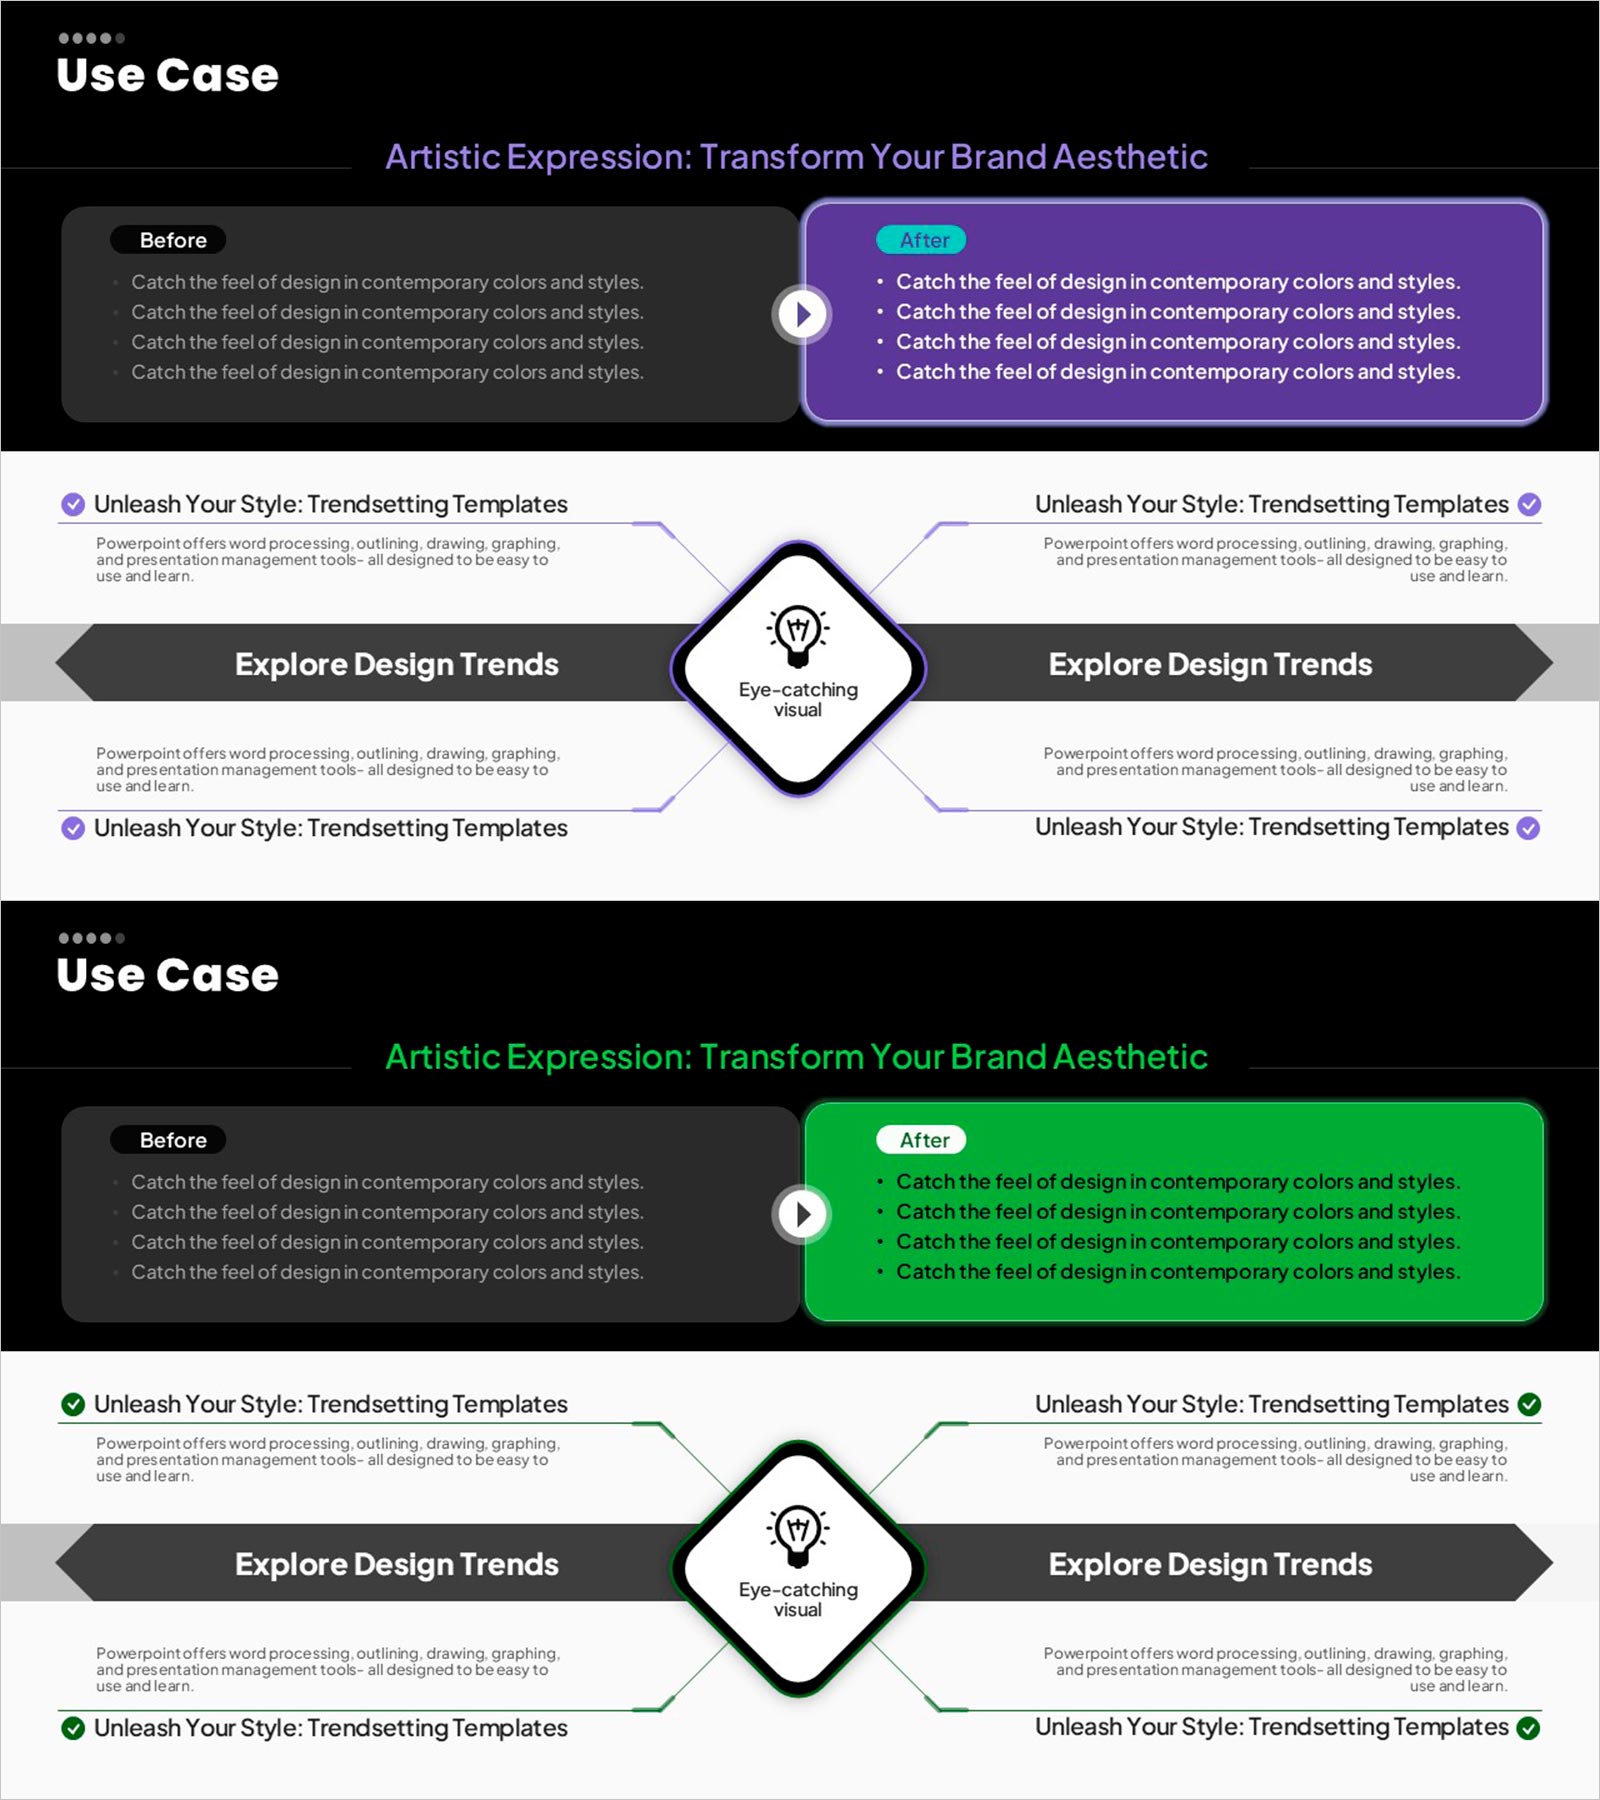
A Before-After comparison diagram PowerPoint slide that visualizes product use cases and business strategy progression. The slide features a two-stage flow structure with the left Before state and right After result connected by an arrow, clearly showing the transformation process. Set against a black background with purple and green accent boxes for maximum contrast, the center icon and text area emphasize the conversion point. This presentation template effectively communicates improvements, performance comparisons, and solution impact in pitch decks, reports, and proposals.
Usage Points
-
Main Usage
Clearly compare and persuade stakeholders about pre- and post-implementation states, stage-by-stage business improvements, and solution effectiveness using a Before-After structure. The slide enables audiences to grasp change causes, processes, and outcomes at a glance.
-
How to Use
Enter current state and pain points in the left Before box, and improved state and solutions in the right After box. Add the key transformation element (technology, strategy, process) in the center icon area to emphasize the driver of change. Purple and green backgrounds are fully customizable to match your theme.
-
Recommended For
Ideal for executives, marketing teams, and sales professionals presenting product impact, business achievements, and strategic improvements. Perfect for investor pitches, client proposals, internal reports, and business plan presentations where demonstrating change and progress is critical.
-
Slide Structure
2-slide deck: Slide 1 is a title slide with title and subtitle. Slide 2 features the Before-After comparison diagram with left Before box, center arrow, icon, right After box, and bottom description area. 16:9 widescreen format optimized for projector and online presentations.
Related Products
-

Visualizing Present and Future Directions – Business Strategy
#Business Strategy #Diagram #As-Is To-Be
-

AS-IS TO-BE Expected Effects Diagram Slide
#Business Strategy #Diagram #Financial Outlook & Expected Impact
-

Smartwatch Product Service Direction and Future
#Business Strategy #Diagram #As-Is To-Be
-

Effective Solutions for Business Growth – Success and Innovation
#Business Strategy #Operational Plan #Diagram
