AS-IS TO-BE Expected Effects Diagram Slide
RM0200016_11
- Last Update 02/05/2025
- File Size 0.3MB
- # of Slides 2
- File Format PPTX
- Slide Ratio 16:9
- Color
Keywords
About the Product
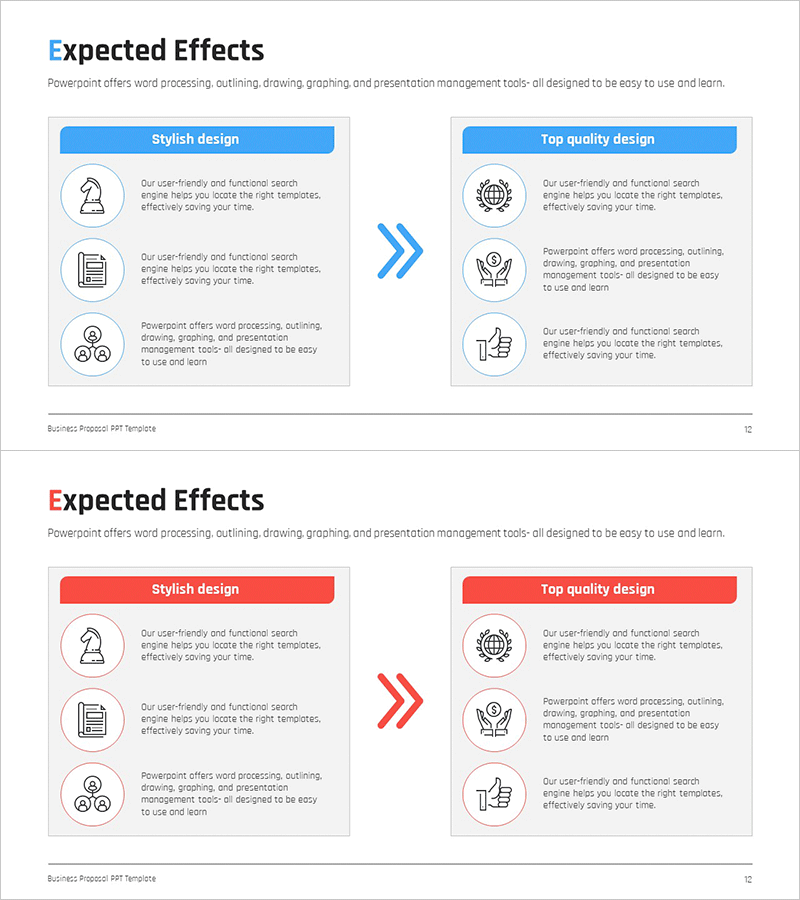
A two-stage linear diagram PowerPoint slide that visualizes the transformation from current state (AS-IS) to target state (TO-BE). The slide features a blue section on the left and a gray section on the right, clearly separated by a central arrow indicating the transition process. Each stage includes three icon placeholders and text areas for detailed descriptions, making it ideal for presenting current situation analysis and improvement directions. This PPT slide is ready to use in business strategy presentations, organizational improvements, system migrations, and change management initiatives.
Usage Points
-
Main Usage
Clearly compare current state and target state while visually communicating the transformation process and expected benefits. This diagram effectively conveys key messages in change management projects such as business improvements, organizational transformation, and system implementations.
-
How to Use
Enter current situation descriptions and icons in the left AS-IS section, and input target state and expected outcomes in the right TO-BE section. The central arrow represents the direction of change, and you can customize the section colors and icons to match your organization's brand palette.
-
Recommended For
Ideal for executives, project managers, organizational development specialists, and strategic planning teams explaining change management initiatives. Perfect for business plans, organizational restructuring proposals, system implementation presentations, and management innovation reports where both current analysis and improvement directions need simultaneous representation.
-
Slide Structure
Two-slide set with the first slide featuring a blue-toned AS-IS TO-BE diagram and the second slide showing the same structure in red tones. Each slide consists of three icon areas on the left, a central arrow, and three icon areas on the right, with ample text input space for detailed descriptions.
Related Products
-

Visualizing Present and Future Directions – Business Strategy
#Business Strategy #Diagram #As-Is To-Be
-

Effective Solutions for Business Growth – Success and Innovation
#Business Strategy #Operational Plan #Diagram
-

Solutions for Your Execution Goals – Linear Flow of Business Vision
#Business Vision and Strategy #Operational Plan #Diagram
-

Diagram-based Wealth-Building Financial Planning Strategy – Setting Goals for Success
#Business Vision and Strategy #Operational Plan #Diagram
