



Visualizing Present and Future Directions – Business Strategy
RB0800008-1_33
- Last Update 03/19/2025
- File Size 1.7MB
- # of Slides 2
- File Format PPTX
- Slide Ratio 4:3
- Color
Keywords
- #Content-Based Slides
- #Design-Based Slides
- #Business Strategy
- #Diagram
- #As-Is To-Be
- #Business Direction
- #Flow
- #Cluster
- #Linear Flow
- #Closed Cluster Diagram
- #4:3
- #closed-form diagram PowerPoint
- #direction visualization slide
- #business strategy diagram
- #two-stage flow chart PPT
- #present future comparison slide
About the Product
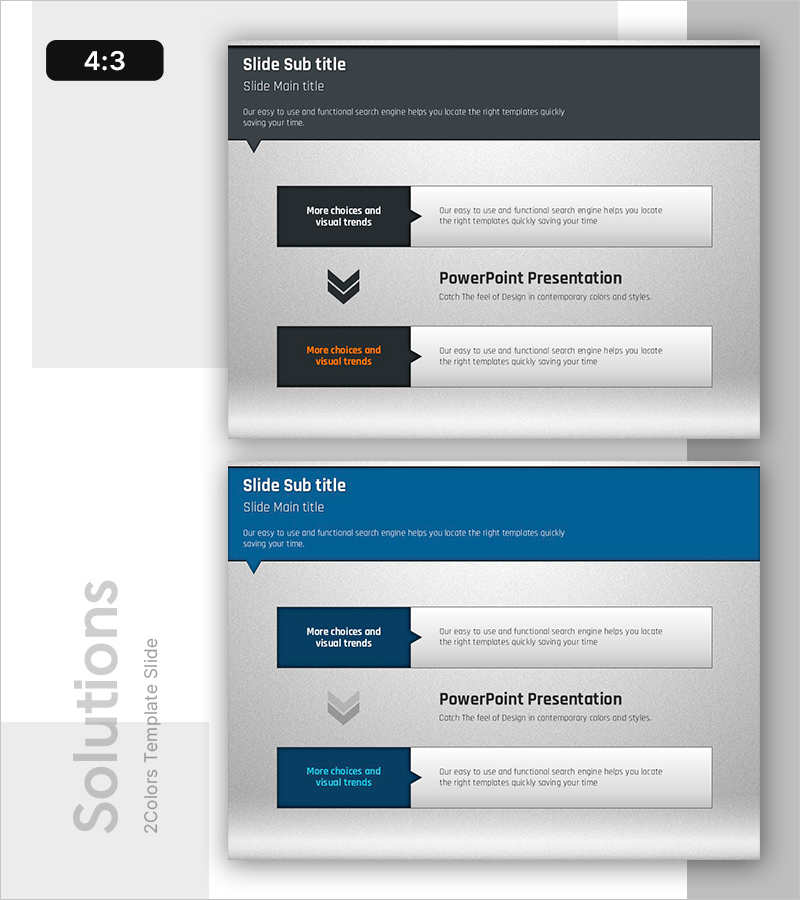
A closed-form diagram PowerPoint slide that visually expresses the direction from present to future state. The contrast between black arrow boxes and gray background clearly conveys information flow, making it ideal for business strategy presentations, organizational change explanations, and project roadmap updates. This 2-slide set is ready to use immediately, with fully editable text and image areas for customized presentations.
Usage Points
-
Main Usage
Visualizes the transition process from current state to future goals in distinct stages. Black arrow boxes highlight key messages while gray background areas provide supporting details, creating clear information hierarchy for audience comprehension.
-
How to Use
Use in business strategy presentations, organizational restructuring explanations, project milestone reports, and change management discussions. Edit the text in each box to create customized content that contrasts current situation with future vision for immediate deployment.
-
Recommended For
Executives, project managers, organizational development specialists, and strategic planning teams explaining directional change. Particularly effective in management meetings, company-wide announcements, and investor presentations requiring current-state analysis and future goal setting.
-
Slide Structure
Two-slide format with title area (dark gray) at top and content area below. Content features two black arrow boxes (left side) and two gray explanation boxes (right side) arranged vertically, with a downward arrow icon in center indicating stage transition.
Related Products
-
Premium Idea Strategy Slide - Business Progress for Awards
#Business Strategy #Diagram #Business Direction
-
Direction of Fountain Pen Business Promotion – Effective Step-by-Step Plan
#Business Strategy #Diagram #Step-by-Step Schedule Plan
-
Camping Itinerary System Diagram – Clear Business Direction
#Business Strategy #Diagram #Business Direction
-
Flowchart of the Construction Propulsion System
#Business Strategy #Operational Plan #Diagram