Effective Solutions for Business Growth – Success and Innovation
RJ0300097_12
- Last Update 05/16/2025
- File Size 0.3MB
- # of Slides 2
- File Format PPTX
- Slide Ratio 16:9
- Color
Keywords
- #Content-Based Slides
- #Design-Based Slides
- #Business Strategy
- #Operational Plan
- #Diagram
- #As-Is To-Be
- #Business Support Plan
- #Flow
- #Cluster
- #Linear Flow
- #Closed Cluster Diagram
- #16:9
- #text box PowerPoint slide
- #comparison analysis presentation
- #left-right contrast diagram
- #business growth slide
- #solution presentation template
About the Product
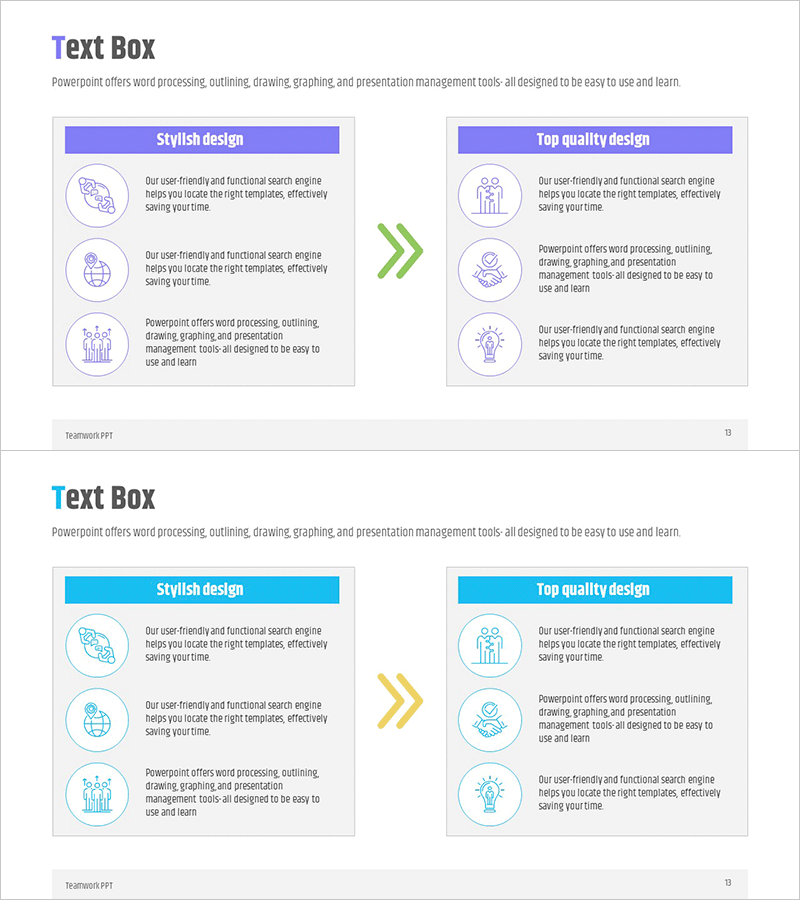
A left-right contrast text box PowerPoint slide template designed for visual comparison of two solutions, strategies, or approaches. Each section features icons and text areas to clarify information delivery, with a central arrow indicating direction of change or transition. This presentation slide is ready to use for business growth strategy discussions, operational plan comparisons, solution presentations, and various corporate communication scenarios. Available in two color versions—blue and cyan tones—allowing you to select the design that best matches your company's brand identity.
Usage Points
-
Main Usage
Visually compare and contrast two business solutions, strategies, or approaches. The left and right sections display different content, while the central arrow represents change or transition, enhancing audience comprehension and engagement.
-
How to Use
Enter existing conditions or the first solution in the left text box, and the improved situation or second solution on the right. Customize icons to match your content and edit text to fit your presentation topic. Select the color version that aligns with your corporate brand guidelines.
-
Recommended For
Ideal for executives, business development teams, marketing professionals, and consultants presenting business strategies, operational plans, new solutions, or improvement proposals. Particularly effective for presentations requiring before-and-after comparisons.
-
Slide Structure
Two-slide set with each slide featuring symmetrical left-right text boxes containing 3 items each. The left side displays a blue or cyan header with 3 circular icons, while the right side shows a contrasting color header with 3 circular icons. A green arrow in the center indicates directionality and flow.
Related Products
-

Visualizing Present and Future Directions – Business Strategy
#Business Strategy #Diagram #As-Is To-Be
-

Camping Itinerary System Diagram – Clear Business Direction
#Business Strategy #Diagram #Business Direction
-

Energy Saving Processes in Everyday Life – Efficiency and Sustainability
#Business Vision and Strategy #Operational Plan #Diagram
-

Effective Diagram Slide for Business Goal and Vision Setting
#Business Vision and Strategy #Diagram #Business Goals
