Data-driven Trend Analysis PowerPoint Template - Market Insights
RM0700005_4
- Last Update 02/26/2025
- File Size 0.2MB
- # of Slides 2
- File Format PPTX
- Slide Ratio 16:9
- Color
Keywords
- #Content-Based Slides
- #Design-Based Slides
- #Market and Competitor Analysis
- #Diagram
- #Graph
- #Market Analysis
- #Market Overview
- #Cluster
- #Horizontal Bar
- #Closed Cluster Diagram
- #Horizontal Bar Chart
- #16:9
- #pie chart PowerPoint slide
- #bar graph presentation template
- #market analysis diagram
- #trend data visualization
- #business insights PPT download
About the Product
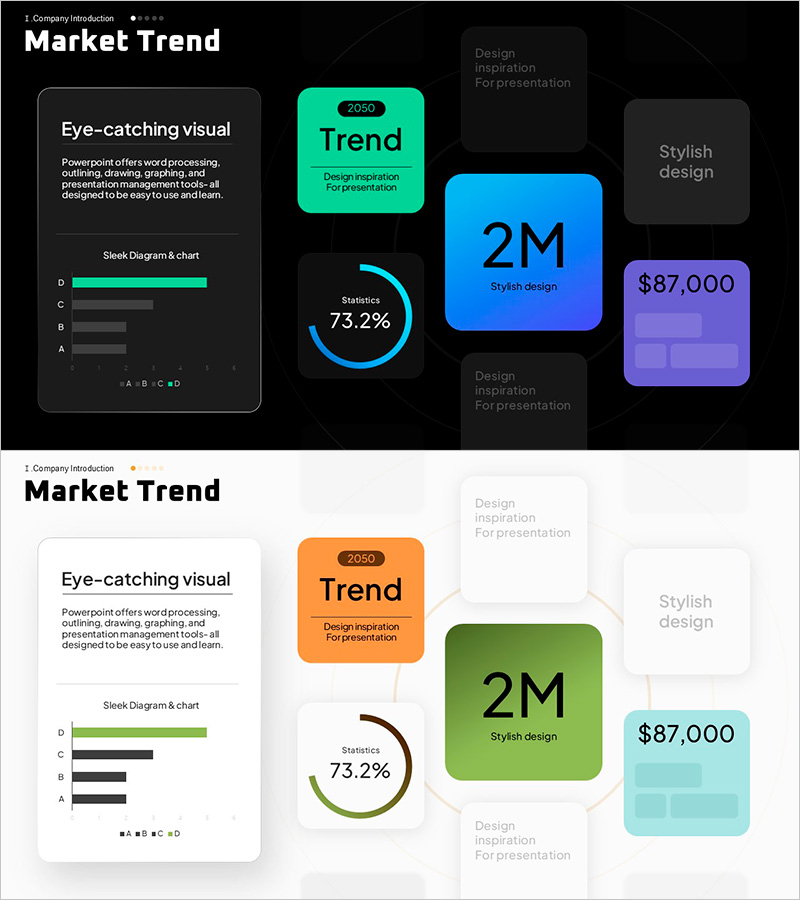
A 2-slide PowerPoint presentation designed to communicate market analysis and trend insights effectively. The first slide features a dark background with a pie chart (73.2% statistics), bar graph, and text boxes that emphasize key data points. The second slide presents the same layout with a light background, allowing you to choose based on your presentation environment. Multiple accent colors—cyan, orange, green, purple, and turquoise—distinguish each data area, making the slides ready for immediate use in presentations and business reports.
Usage Points
-
Main Usage
Visually represent statistical data and ratio information in market analysis reports, business insight presentations, and trend analysis materials. The pie chart clarifies composition percentages while the bar graph enables clear numerical comparison between items, enhancing audience comprehension.
-
How to Use
Use the dark background slide for projector environments or online presentations, and the light background slide for printed materials or well-lit conference rooms. Replace text boxes and figures with your own data, and adjust accent colors as needed for your specific presentation context.
-
Recommended For
Marketing professionals, executives, data analysts, and consultants presenting market conditions, quarterly performance reports, and competitive analysis. Ideal for finance, IT, retail, and manufacturing industries where data-driven decision-making is essential.
-
Slide Structure
Slide 1 (dark background): Left text box for descriptions, center pie chart showing 73.2% statistics, three upper-right accent text boxes for trend/style/price information, and bottom bar graph comparing four items. Slide 2 (light background): Identical layout rendered in light tones, providing background selection flexibility.
Related Products
-

Market Trend Analysis Charts & Tables – The Power of Data Visualization
#Market and Competitor Analysis #Diagram #Graph
-

Mobile SNS Market Analysis Graph – Visualizing Competitor Analysis Data
#Market and Competitor Analysis #Diagram #Graph
-

Market Overview Analysis Slides – Insights & Data at a Glance
#Market and Competitor Analysis #Diagram #Market Analysis
-

Professional Presentation Slide Visualizing Performance Chart Statistics
#Market and Competitor Analysis #Diagram #Graph
