Market Trend Analysis Charts & Tables – The Power of Data Visualization
RM0400011_7
- Last Update 02/18/2025
- File Size 0.6MB
- # of Slides 2
- File Format PPTX
- Slide Ratio 16:9
- Color
Keywords
- #Content-Based Slides
- #Design-Based Slides
- #Market and Competitor Analysis
- #Diagram
- #Graph
- #Market Analysis
- #Market Overview
- #Table
- #Horizontal Bar
- #Standard Table
- #Horizontal Bar Chart
- #16:9
- #market analysis chart PowerPoint
- #horizontal bar chart slide
- #data comparison presentation
- #market segmentation PPT
- #comparison table slide
- #data visualization template
About the Product
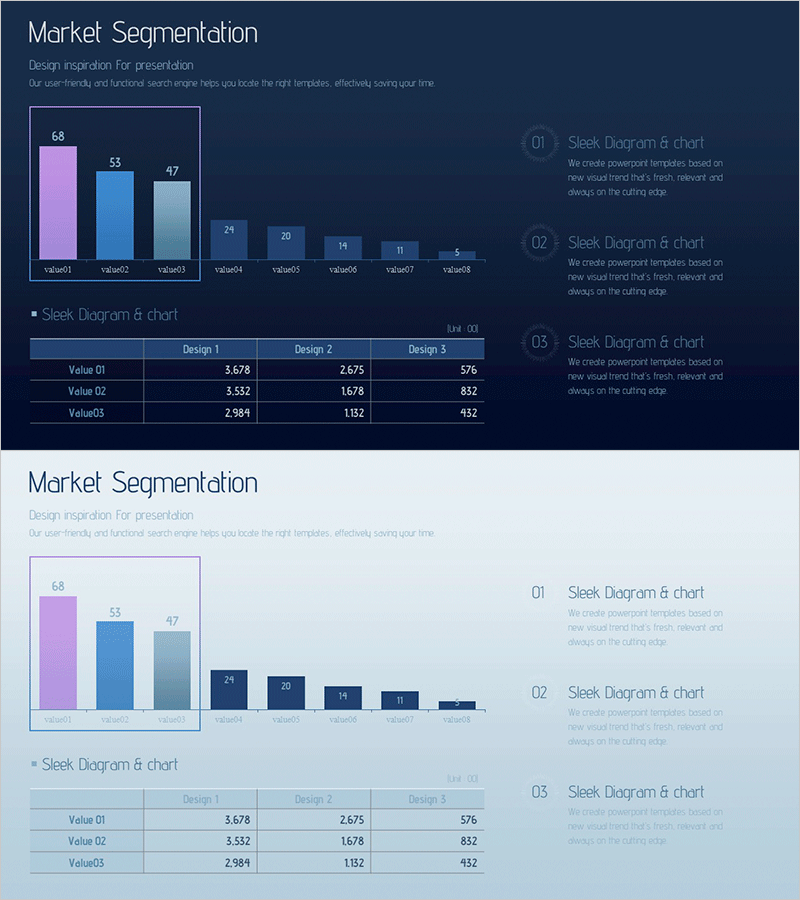
A 2-slide PowerPoint presentation for market segmentation analysis. The first slide displays 8 data points as a horizontal bar chart on a dark blue background, highlighting key values (68, 55, 47) for visual emphasis. The second slide presents a 3×3 comparison table across three design scenarios and three metrics. Ideal for presentations on market trends, competitive analysis, and sales performance. The 16:9 widescreen format ensures compatibility with modern presentation environments and projector displays.
Usage Points
-
Main Usage
Present quantitative market data through both bar chart and table formats to enhance audience comprehension. The horizontal bar chart excels at comparing values across categories, while the table enables multi-criteria comparison for strategic decision-making.
-
How to Use
Input actual market data into the first slide's bar chart and populate the second slide's table with scenario-specific performance metrics. The high-contrast dark blue design ensures clarity in projection environments. Each slide functions independently for flexible presentation flow.
-
Recommended For
Marketing managers, sales directors, and executives preparing data-driven reports. Suitable for market research presentations, quarterly performance reviews, and new product positioning strategy discussions.
-
Slide Structure
Slide 1: Horizontal bar chart with 8 data points (value01–value08), top 3 values highlighted, legend included. Slide 2: 3-row (Value 01/02/03) × 3-column (Design 1/2/3) table with numeric data entry fields. 16:9 aspect ratio, PPTX format.
Related Products
-

Data-driven Trend Analysis PowerPoint Template - Market Insights
#Market and Competitor Analysis #Diagram #Graph
-

Pentagon Diagram & Table Chart – Market Analysis and Competitive Insight
#Market and Competitor Analysis #Diagram #Market Analysis
-

Sugar Content Analysis Bar Graph Table
#Market and Competitor Analysis #Diagram #Graph
-

Industry Trend Analysis Donut Chart – Visual Trends Presentation
#Market and Competitor Analysis #Diagram #Graph
