Market Share Change Visualized in Donut Chart
RM0400012_7
- Last Update 02/18/2025
- File Size 1MB
- # of Slides 2
- File Format PPTX
- Slide Ratio 16:9
- Color
Keywords
- #Content-Based Slides
- #Design-Based Slides
- #Market and Competitor Analysis
- #Diagram
- #Graph
- #Market Analysis
- #Market Overview
- #Cluster
- #Circles
- #Closed Cluster Diagram
- #Doughnut Chart
- #16:9
- #donut chart PowerPoint
- #pie chart slide template
- #market share visualization
- #competitive analysis presentation
- #how to create donut chart in PowerPoint
- #market segmentation slide download
About the Product
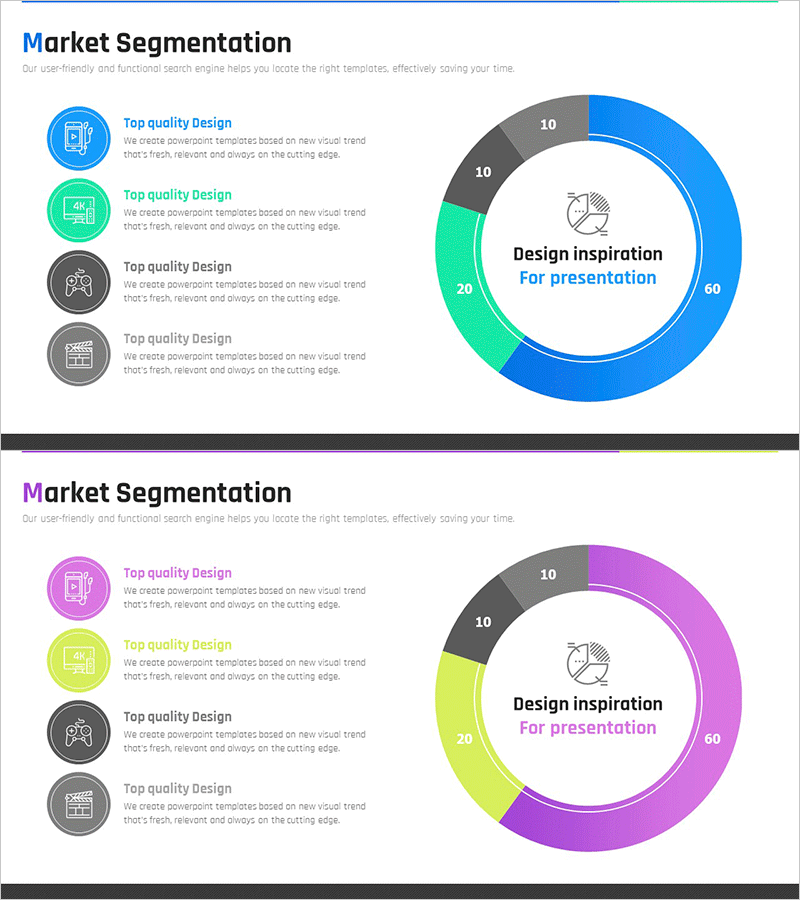
A professional donut chart PowerPoint slide designed to visualize market share changes and competitive analysis at a glance. The circular graph features four color segments—blue, green, purple, and gray—enabling clear comparison of market share percentages across competing companies. The center area accommodates an icon and text to emphasize key messages, making it ideal for business reports, marketing presentations, and executive briefings. This 2-slide template is optimized for 16:9 widescreen format and allows instant customization for various market analysis scenarios.
Usage Points
-
Main Usage
Effectively display proportional data such as market share, competitor percentages, customer segmentation, or product sales composition across four or more categories. The center area highlights key metrics or messages to draw audience attention and emphasize critical insights.
-
How to Use
Input your data values and the proportions automatically adjust within the donut chart segments. Customize colors to match your brand guidelines or presentation theme. Modify legend text and center content to fit your specific business context. Ideal for quarterly reports, strategic planning sessions, and investor presentations.
-
Recommended For
Marketing managers, executives, business strategists, and sales leaders presenting market analysis. Recommended for quarterly business reviews, new market entry proposals, competitive landscape presentations, investor relations meetings, and strategic planning sessions.
-
Slide Structure
Two-slide template featuring a 4-segment donut chart with blue, green, purple, and gray sections. The center displays a clock icon with 'Design inspiration For presentation' text. The second slide maintains the same donut chart structure for flexible data representation across multiple scenarios.
Related Products
-

Pie Chart of Shooting Status Analysis – Visual Insights
#Product/Service Introduction #Market and Competitor Analysis #Diagram
-

Global Business Growth Analysis Status Graph
#Company Introduction #Market and Competitor Analysis #Diagram
-

Donut Chart Slide for Dessert Menu Research – Market Analysis
#Market and Competitor Analysis #Diagram #Graph
-

Donut Chart Comparing Market Share by Coffee Brand
#Market and Competitor Analysis #Diagram #Graph
