Market Overview Analysis Slides – Insights & Data at a Glance
RM0400005_7
- Last Update 02/15/2025
- File Size 3MB
- # of Slides 2
- File Format PPTX
- Slide Ratio 16:9
- Color
Keywords
- #Content-Based Slides
- #Design-Based Slides
- #Market and Competitor Analysis
- #Diagram
- #Market Analysis
- #Market Overview
- #Cluster
- #Table
- #Closed Cluster Diagram
- #16:9
- #closed cluster diagram PowerPoint
- #market segmentation slide template
- #competitive analysis diagram
- #cluster diagram PPT slide
- #market analysis presentation template
About the Product
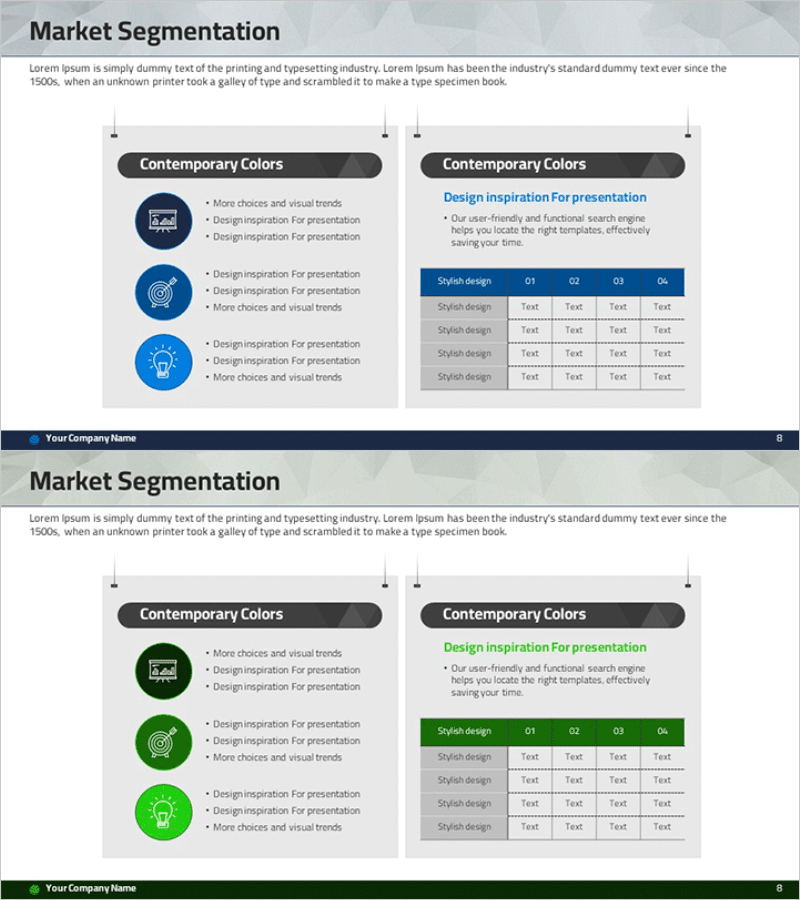
A closed cluster diagram PowerPoint slide designed for market analysis and competitive positioning. Three overlapping circular zones visualize market segmentation, customer groups, and competitive landscape. The left side features an icon-based item list with three key elements, while the right side displays a data table combining qualitative insights with quantitative metrics. Available in navy and green color schemes with clear boundary lines and icons to distinguish information hierarchy. Ready-to-use for presentations, business plans, and analytical reports.
Usage Points
-
Main Usage
Visualize market overview, competitive positioning, and customer segmentation using three overlapping zones to make complex market structures instantly comprehensible. The intersection relationships clarify strategic decision-making foundations and competitive advantages.
-
How to Use
Enter market segments, competitors, or customer groups in the left icon list, then populate the right data table with corresponding metrics such as market size, growth rate, or market share. Adjust zone colors and transparency to represent priority levels or importance hierarchy.
-
Recommended For
Marketing managers, strategy planners, business analysts, consultants, and executives. Ideal for market analysis, competitive strategy, customer segmentation, new business planning, and investor pitch decks.
-
Slide Structure
Two-slide set: Slide 1 features title area (Market Segmentation) + descriptive text + three overlapping circular clusters (three icons per zone) + right-side data table (4 rows × 5 columns). Slide 2 presents identical layout in green color variant. 16:9 widescreen format, fully editable PPTX with all elements customizable.
Related Products
-

Industry Trend Analysis Donut Chart – Visual Trends Presentation
#Market and Competitor Analysis #Diagram #Graph
-

Detailed Analysis in Book Illustration PowerPoint Template
#Market and Competitor Analysis #Diagram #Graph
-

Market Share Change Visualized in Donut Chart
#Market and Competitor Analysis #Diagram #Graph
-

Performance Analysis with Donut Chart and Table
#Market and Competitor Analysis #Diagram #Graph
