Service Composition Diagram – Technical Application and Visualization
RM0700002_16
- Last Update 07/25/2025
- File Size 0.4MB
- # of Slides 2
- File Format PPTX
- Slide Ratio 16:9
- Color
Keywords
- #Content-Based Slides
- #Design-Based Slides
- #Technical Approach
- #Diagram
- #Service Architecture Diagram
- #System Architecture Diagram
- #Flow
- #Linear Flow
- #16:9
- #service composition diagram PowerPoint
- #system structure diagram slide
- #linear flowchart template
- #technical architecture PPT
- #3-step process diagram
About the Product
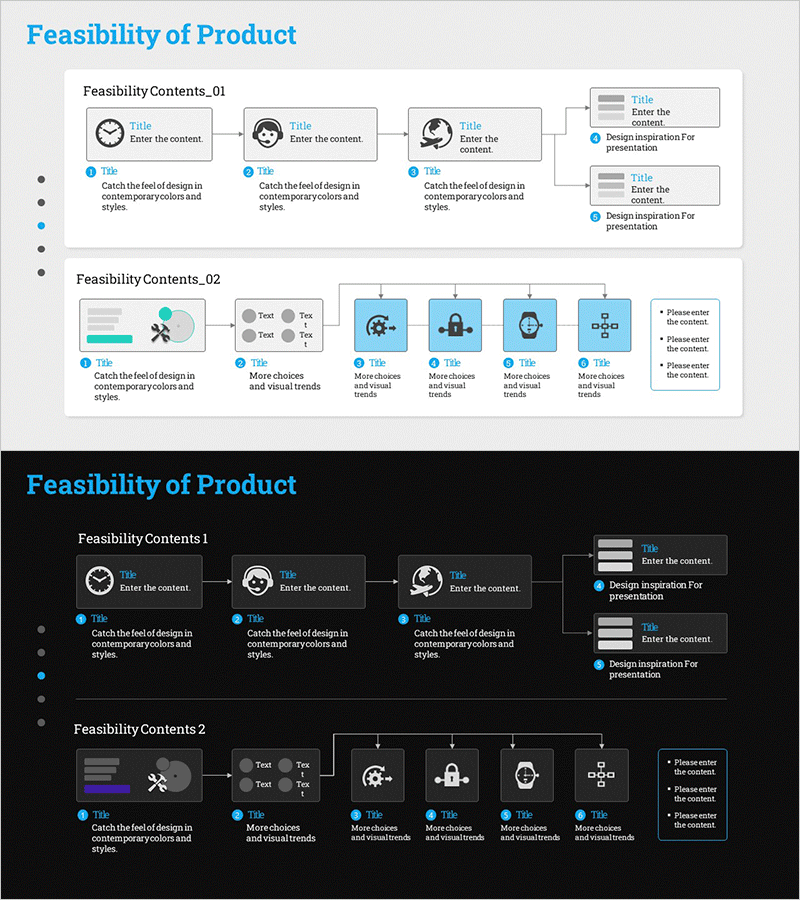
A 3-step linear diagram PowerPoint slide that clearly visualizes technology-based service architecture and system composition. Each stage features dedicated icon and text input areas, enabling intuitive representation of service workflows, system structures, and technical application processes. The consistent teal color scheme reinforces technical credibility and trustworthiness. An additional information box in the upper right allows supplementary explanations of key concepts. This presentation template is ready for immediate use in technical presentations, system documentation, and service introduction slides.
Usage Points
-
Main Usage
A linear diagram designed to clearly express the sequential stages of technology-based service composition and system architecture. It effectively communicates service workflows, system structures, and technical processes through a left-to-right progression, making stage relationships and dependencies immediately apparent to audiences.
-
How to Use
Enter service stage names in the icon areas of each step, and add detailed descriptions in the text boxes below. Use the upper right information box to highlight key features, technical specifications, or overall service benefits. All colors and icons are fully editable to match your corporate branding and presentation style.
-
Recommended For
IT and technology presentations, system architecture explanations, service roadmap introductions, technical planning documents, product development process descriptions, digital transformation strategy presentations, technology seminars, system integration (SI) proposals, and enterprise software demonstrations.
-
Slide Structure
Three connected nodes arranged left-to-right, each containing an icon placeholder and text input area. Arrows between nodes indicate linear progression and logical flow. An independent information box positioned in the upper right provides space for supplementary details or key messaging. Two slides included with various service composition examples.
Related Products
-

Internet Security Platform Structure Diagram – Stability and Innovation
#Business Strategy #Technical Approach #Diagram
-

Sea Wide PPT Organization – Visually Appealing Diagram
#Technical Approach #Diagram #Service Architecture Diagram
-

Auto Business Ops Diagram – Efficiency and Innovation
#Technical Approach #Diagram #Service Architecture Diagram
-

Activity Plan Structure Diagram – Effective Business Management
#Business Management #Technical Approach #Diagram
