Innovative Diagram for Food Ingredient Composition
RJ0800051_15
- Last Update 08/14/2025
- File Size 2.5MB
- # of Slides 2
- File Format PPTX
- Slide Ratio 16:9
- Color
Keywords
About the Product
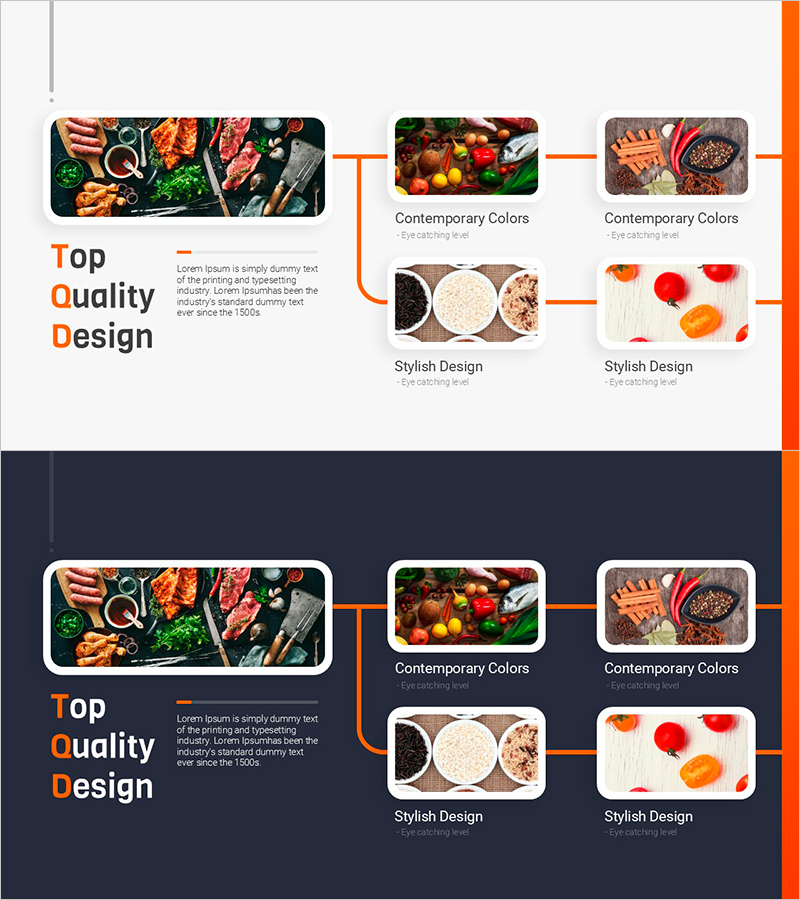
A radial connection diagram PowerPoint slide that visually represents the compositional relationships of food ingredients. The design features a central hub element with five directional branches extending outward, intuitively illustrating ingredient interdependencies and supply chain connections. Set against a modern two-tone background combining orange and black with food photography, this slide template is ready to use in food industry presentations, marketing plans, and product introduction decks. Delivered in 16:9 widescreen format with 2 fully editable slides in PPTX.
Usage Points
-
Main Usage
Designed for food and beverage businesses to visually explain ingredient composition, supply chains, and manufacturing processes. The radial structure extending from a central element to five outer nodes clearly expresses hierarchical relationships and interconnections, significantly enhancing audience comprehension.
-
How to Use
Input ingredient names, process steps, or characteristics into the text boxes on each slide, and insert corresponding food images into the designated photo areas. Colors, line thickness, and node sizes are fully adjustable using PowerPoint's native tools, and additional nodes can be duplicated to expand the diagram structure.
-
Recommended For
Ideal for food manufacturing, distribution, and restaurant industry executives, marketing teams, and sales professionals presenting product composition, raw material sourcing, and supply chain management. Also effective for food-related educational seminars, workshops, and consulting presentations where complex ingredient relationships need to be simplified and communicated.
-
Slide Structure
Two-slide set featuring a radial connection structure with 5 nodes: the first slide displays the diagram on a light background, the second on a dark background. Each node contains a food photography area and text input field, connected to the central hub by orange directional arrows radiating outward.
Related Products
-

Chromosome Theme Wide PowerPoint Template – Stylish Diagram Composition
#Technical Approach #Diagram #Service Architecture Diagram
-

Linked Process Execution Diagram – Cluster and Service Composition
#Technical Approach #Diagram #Service Architecture Diagram
-

Shape Configuration Diagram – Visualizing Technology Sectors
#Technical Approach #Diagram #Service Architecture Diagram
-

Core Values Linked to the Central System
#Technical Approach #Diagram #Service Architecture Diagram
