Brown Composition Diagram of the Background of Ingredients – Efficient System Structuring
RJ0800030_4
- Last Update 08/08/2025
- File Size 5.4MB
- # of Slides 2
- File Format PPTX
- Slide Ratio 16:9
- Color
Keywords
- #Content-Based Slides
- #Design-Based Slides
- #Technical Approach
- #Diagram
- #Service Architecture Diagram
- #System Architecture Diagram
- #Structure
- #Tree Diagram
- #16:9
- #tree diagram PowerPoint
- #organizational chart slide template
- #hierarchy structure diagram
- #organizational structure PowerPoint
- #4-level org chart template
About the Product
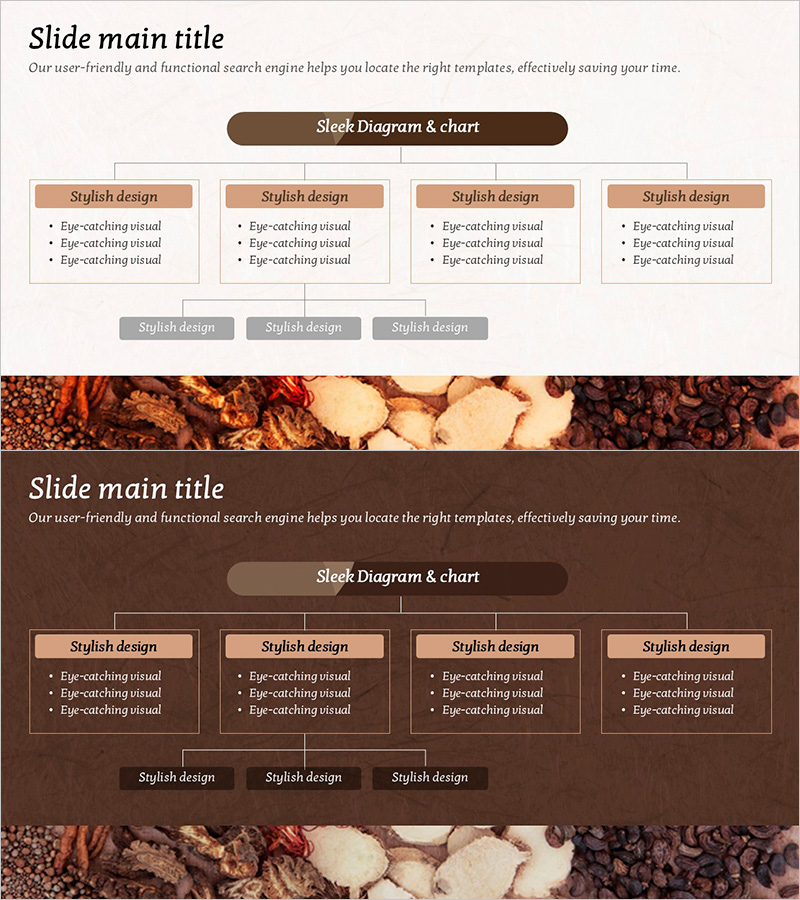
A hierarchical organizational chart PowerPoint slide featuring a warm brown food-themed background. This template visualizes a 4-level organizational structure with a single top node expanding downward through multiple tiers. Beige and terracotta-colored rectangular boxes represent each position, connected by vertical lines that clearly show reporting relationships and hierarchical dependencies. The design effectively communicates organizational structure, departmental hierarchy, and team composition. Ideal for corporate presentations, organizational restructuring announcements, and team structure documentation that require clear visual representation of roles and responsibilities.
Usage Points
-
Main Usage
Designed to visually represent organizational hierarchies, departmental structures, and team compositions with clarity and precision. The 4-level structure enables viewers to quickly understand reporting relationships, role distribution, and organizational flow from executive level through operational teams.
-
How to Use
Use in company introduction presentations, organizational restructuring announcements, employee onboarding sessions, and team building workshops. Simply replace placeholder text with actual department names, job titles, and employee names. Colors, fonts, and layout are fully editable to match corporate branding guidelines.
-
Recommended For
HR and personnel departments presenting organizational changes, executive presentations for company structure, new employee orientation materials, consulting firms analyzing client organizations, and startups explaining team composition and reporting structures.
-
Slide Structure
Single top-level node expanding into a 4-tier hierarchical tree structure. Each level contains rectangular boxes connected by vertical lines showing parent-child relationships. Two slide layout variations provided—light background and dark background—enabling flexible use across different presentation environments and lighting conditions.
Related Products
-

Organizational Structure Analysis - Efficient System Model
#Technical Approach #Diagram #Service Architecture Diagram
-

Circular Tree Structure Slide – Efficient Service Diagram
#Technical Approach #Diagram #Service Architecture Diagram
-

Execution Framework Toward Strategic Goals – Effective Business Presentation
#Technical Approach #Diagram #Service Architecture Diagram
-

Pet Template Tree Structure – Optimized Visual for Service Diagram
#Technical Approach #Diagram #Service Architecture Diagram
