Linked Process Execution Diagram – Cluster and Service Composition
RB0100046_9
- Last Update 03/06/2025
- File Size 1.4MB
- # of Slides 2
- File Format PPTX
- Slide Ratio 4:3
- Color
Keywords
About the Product
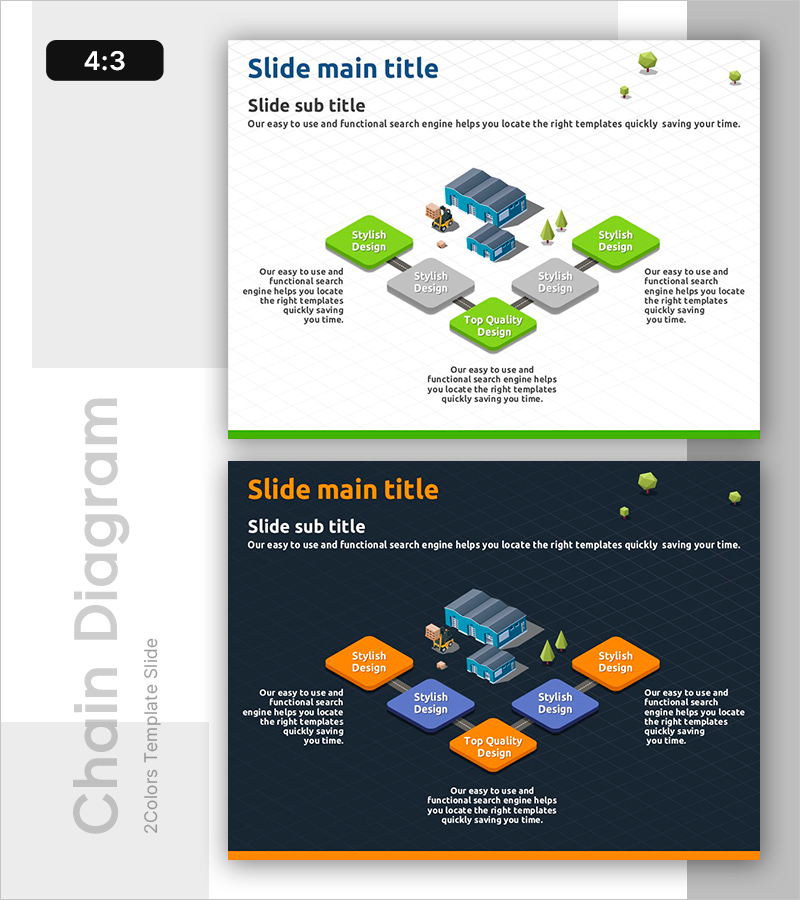
A 6-node cluster connection diagram PowerPoint slide designed to visualize cloud architecture, microservices, and system infrastructure design. The nested structure radiates from a central hub to surrounding nodes, clearly expressing service interdependencies and hierarchical relationships. The lime-green and gray two-tone color scheme distinguishes primary and secondary elements, while 3D isometric building and vehicle illustrations symbolize real infrastructure environments. This presentation template is ready to use for technology department presentations, system architecture explanations, and cloud service composition diagrams.
Usage Points
-
Main Usage
Clearly visualize node-to-node connection relationships in cloud architecture, microservices structure, and system infrastructure design. The nested structure radiating from a central hub to surrounding services expresses hierarchical dependencies, optimized for technical architecture explanations.
-
How to Use
Use in technology department presentations, system design proposals, and cloud service composition diagram explanations. Customize by replacing node text with actual service names and module names, and add arrows and connection lines to illustrate data flow.
-
Recommended For
IT architects, cloud engineers, system designers, technical leaders, DevOps teams, and software development departments. Recommended for technology stack explanations, microservices architecture proposals, and infrastructure modernization project presentations.
-
Slide Structure
6-node nested structure with 1 central hub node and 5 surrounding cluster nodes. Three lime-green primary service nodes and three gray secondary support nodes distinguish hierarchy levels. 3D isometric building and vehicle illustrations represent real-world environments. 4:3 aspect ratio, 2-slide composition.
Related Products
-

Core Values Linked to the Central System
#Technical Approach #Diagram #Service Architecture Diagram
-

Core Services Connection Diagram – Visualizing System and Service Compositions
#Technical Approach #Diagram #Service Architecture Diagram
-

Chromosome Theme Wide PowerPoint Template – Stylish Diagram Composition
#Technical Approach #Diagram #Service Architecture Diagram
-

Innovative Diagram for Food Ingredient Composition
#Technical Approach #Diagram #Service Architecture Diagram
