Investor Ratio Comparison Analysis Chart – Market Status and Competitive Analysis
RM0600004_6
- Last Update 02/24/2025
- File Size 0.3MB
- # of Slides 2
- File Format PPTX
- Slide Ratio 16:9
- Color
Keywords
- #Content-Based Slides
- #Design-Based Slides
- #Company Introduction
- #Market and Competitor Analysis
- #Diagram
- #Graph
- #Shareholder Structure
- #Market Status
- #Table
- #Circles
- #Standard Table
- #Doughnut Chart
- #16:9
- #donut pie chart PowerPoint
- #shareholder composition ratio slide
- #investor ratio presentation
- #circular chart template
- #ratio comparison analysis PowerPoint
About the Product
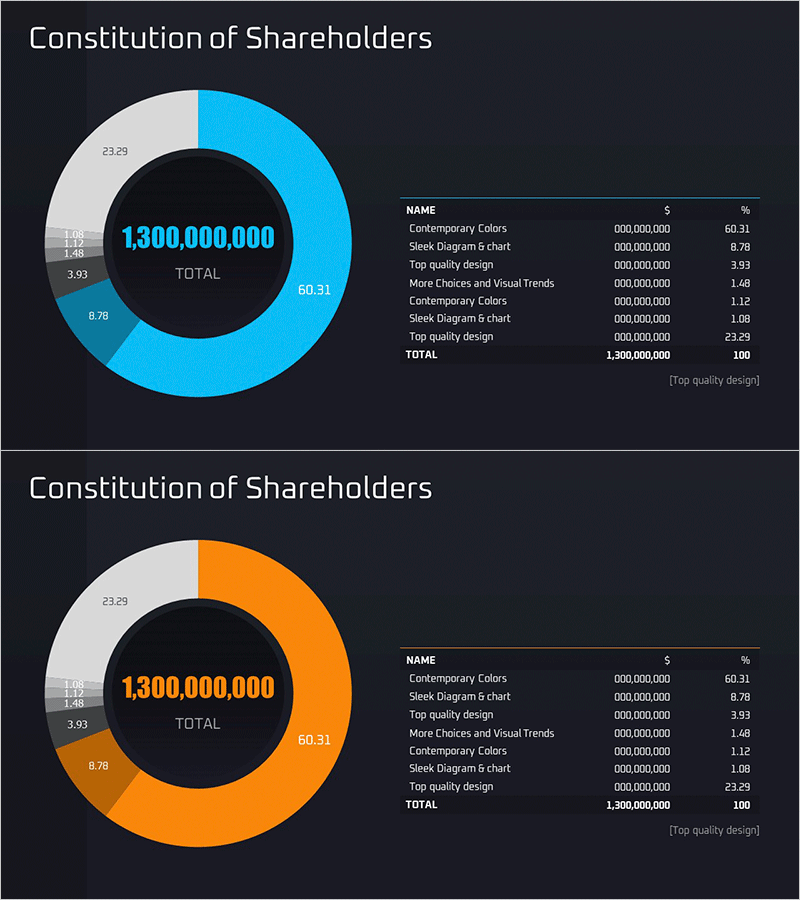
A donut pie chart PowerPoint slide designed to visualize shareholder composition and investor ratio distribution. This 2-slide set features two color versions—cyan and orange—with a central emphasis area for total amount display. Each slide clearly represents 5–7 data segments with percentage values, accompanied by a data table on the right side showing precise numerical information. Ideal for financial presentations, market analysis, competitive benchmarking, and investor pitch decks that require clear ratio visualization and data transparency.
Usage Points
-
Main Usage
Visualizes shareholder composition, investor ratios, and market share distribution using a donut pie chart format. The central total amount display emphasizes scale, while the accompanying data table provides precise numerical values, enabling credible financial communication and stakeholder transparency.
-
How to Use
Apply this slide in investor pitch presentations, shareholder meetings, financial reports, and business plan documents within the financial and market analysis sections. Double-click on chart elements, labels, values, and colors to customize the slide with your own data and branding.
-
Recommended For
CFOs, financial analysts, investor relations (IR) managers, executives, consultants, and marketing strategists preparing market analysis and competitive comparison materials. Particularly suited for presentations requiring quantitative data-driven credibility and professional financial visualization.
-
Slide Structure
Two-slide set featuring identical donut pie chart layouts in cyan (60.31% emphasis) and orange (60.31% emphasis) color schemes. Each slide displays the total amount (1,300,000,000) in the central black circle, divides the outer donut ring into 5–7 segments, and includes a right-aligned data table with item names, values, and percentages.
Related Products
-

Shareholder Status Detailed Analysis Pie Chart & Table – Impactful Data Visualization
#Company Introduction #Market and Competitor Analysis #Diagram
-

Shareholder Status Analysis Donut Pie Chart – Corporate Growth and Competitive Analysis
#Company Introduction #Market and Competitor Analysis #Diagram
-

Chart of Changes in the Ratio of Institutional and Individual Investors – Simplified Shareholder Composition
#Company Introduction #Market and Competitor Analysis #Graph
-

Graph of Analysis of Major Shareholder Stake - Effective Comparison
#Company Introduction #Market and Competitor Analysis #Graph
