Doughnut Chart for Shareholder Composition Analysis – Emphasizing Trust and Transparency
RM0600007_6
- Last Update 02/25/2025
- File Size 0.3MB
- # of Slides 2
- File Format PPTX
- Slide Ratio 16:9
- Color
Keywords
- #Content-Based Slides
- #Design-Based Slides
- #Company Introduction
- #Market and Competitor Analysis
- #Graph
- #Other
- #Shareholder Structure
- #Market Status
- #Circles
- #Doughnut Chart
- #16:9
- #doughnut chart PowerPoint
- #pie chart slide template
- #shareholder composition presentation
- #ratio analysis slide
- #donut chart download
About the Product
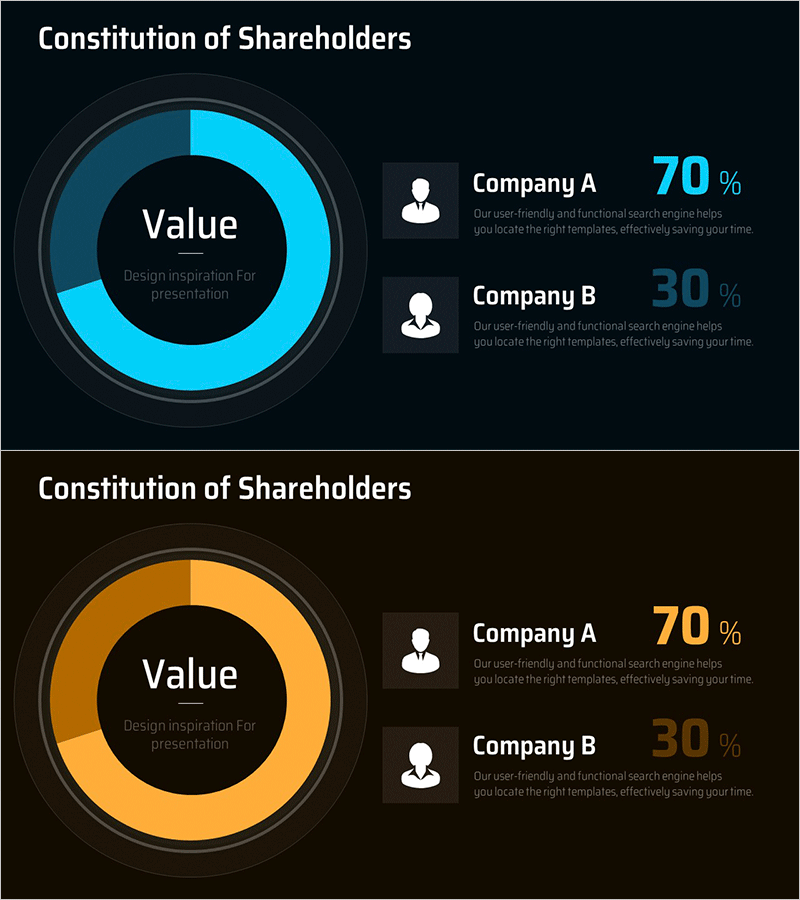
A professional doughnut chart PowerPoint slide designed for shareholder composition analysis and investor presentations. The slide features a two-segment donut chart with cyan and orange color schemes on a dark background, clearly displaying shareholder ratios (70% vs 30%). The center circular area highlights a key message or core value, while the right side includes user icons and detailed information for each shareholder. This 2-slide template offers both cyan and orange background versions, allowing you to match your corporate brand colors. Delivered in 16:9 widescreen PPTX format for immediate editing and seamless integration into your presentation deck.
Usage Points
-
Main Usage
This doughnut chart slide effectively visualizes shareholder composition ratios while emphasizing a central message or core value. The dual-segment design allows you to present two primary shareholders or stakeholder groups with clear percentage breakdown. Ideal for investor relations presentations, shareholder meetings, and corporate overview decks where transparency and trust are essential to your message.
-
How to Use
Open the slide and replace the sample percentages (70%, 30%) with your actual shareholder ratios. Update the shareholder names and descriptions in the right-side text area, and modify the center message to reflect your company's key value or strategic focus. Choose between the cyan or orange background version to align with your corporate branding, then insert into your presentation.
-
Recommended For
Investor relations (IR) professionals, corporate strategy teams, financial reporting specialists, shareholder meeting coordinators, and executive presenters. Particularly valuable for public companies, venture capital firms, private equity funds, and organizations where shareholder structure is critical to stakeholder communication.
-
Slide Structure
Two-slide template featuring cyan background version and orange background version. Each slide uses a three-column layout: left side displays the 2-segment doughnut chart with gradient shading (70% vs 30% ratio), center area provides a circular emphasis zone for key messaging, and right side contains two user icons with corresponding shareholder names and descriptive text arranged vertically.
Related Products
-

Idea Presentation Template Wide – Market Analysis and Visualization
#Market and Competitor Analysis #Graph #Other
-

Regional Analysis of Retiree Lifestyle & Environment – Market Status Visualization
#Market and Competitor Analysis #Graph #Other
-

Avocado Share Chart – Market Status and Competitive Analysis
#Market and Competitor Analysis #Graph #Other
-

Graph of Sales by Region – Visualizing Market Status
#Market and Competitor Analysis #Graph #Other
