Key Shareholder Analysis One Donut Chart
RM0600002_6
- Last Update 02/23/2025
- File Size 1.1MB
- # of Slides 2
- File Format PPTX
- Slide Ratio 16:9
- Color
Keywords
About the Product
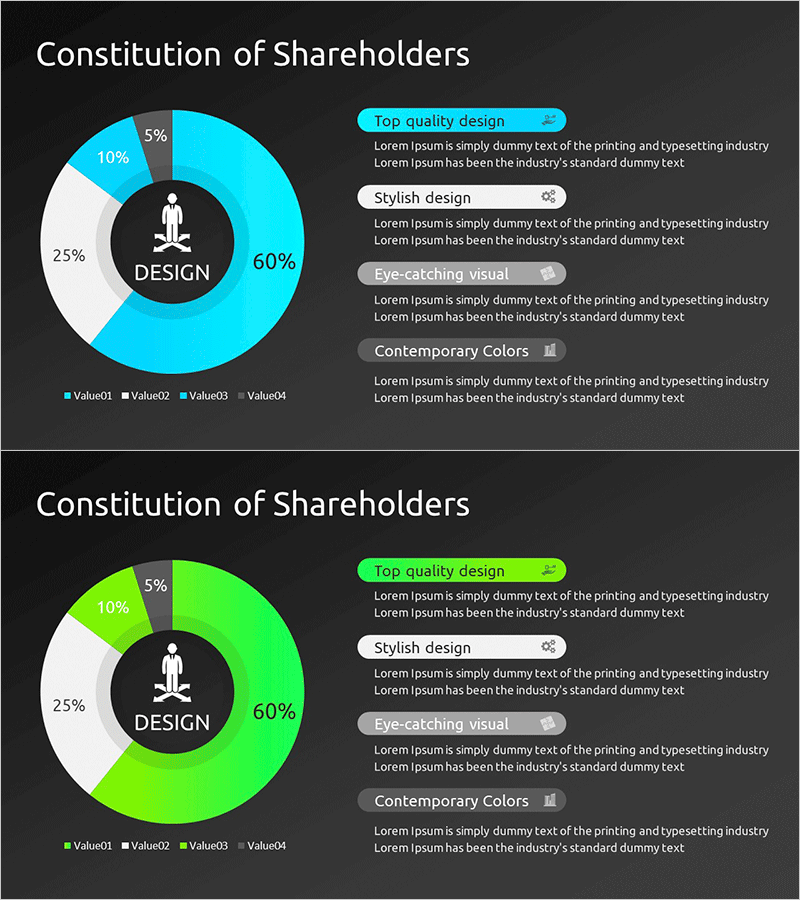
A professional donut chart PowerPoint slide for visualizing key shareholder composition and equity distribution. The design features a centered icon within a black circular background, surrounded by a four-segment donut chart in cyan, green, white, and gray tones that clearly represent shareholder percentages. The right side includes dedicated text areas for detailed information about each shareholder group, enabling comprehensive data presentation. This 2-slide set in 16:9 widescreen format is optimized for modern business presentations and financial reporting. Ideal for shareholder meetings, investor relations presentations, financial statements, and corporate governance disclosures where stakeholder structure needs clear visual communication.
Usage Points
-
Main Usage
Visualize shareholder composition, equity percentages, and investor structure using a donut chart format for shareholder meetings, IR presentations, and financial reports. The centered icon emphasizes key messaging while color-coded segments distinguish different shareholder groups for immediate comprehension.
-
How to Use
The 2-slide set allows layered presentation: first slide shows overall shareholder composition, second slide provides detailed analysis of major shareholders. Input shareholder names, equity percentages, and investment amounts in the right-side text areas. Adjust donut segment colors to match your data categories and replace the center icon with your company logo or shareholder-related symbol.
-
Recommended For
CFOs, investor relations managers, financial analysts, and corporate governance teams preparing shareholder meeting materials, quarterly financial reports, and investor briefing presentations. Particularly valuable for financial services, insurance, real estate, and manufacturing sectors where shareholder structure is strategically important.
-
Slide Structure
2-slide composition. Each slide features a centered black circular background with white icon, surrounded by a 4-segment donut chart (cyan 60%, green 10%, white 25%, gray 5%). Right side displays four labeled information boxes with icons and descriptive text. Dark background with high-contrast colors ensures data visibility and professional appearance in both digital and printed formats.
Related Products
-

Investor Ratio Comparison Analysis Chart – Market Status and Competitive Analysis
#Company Introduction #Market and Competitor Analysis #Diagram
-

Doughnut Chart for Shareholder Composition Analysis – Emphasizing Trust and Transparency
#Company Introduction #Market and Competitor Analysis #Graph
-

Graph of Analysis of Major Shareholder Stake - Effective Comparison
#Company Introduction #Market and Competitor Analysis #Graph
-

Chart of Changes in the Ratio of Institutional and Individual Investors – Simplified Shareholder Composition
#Company Introduction #Market and Competitor Analysis #Graph
