Key Financial Indicators and Budget Slide – A Harmony of Blue and Red
RJ0400020_15
- Last Update 05/22/2025
- File Size 0.5MB
- # of Slides 2
- File Format PPTX
- Slide Ratio 16:9
- Color
Keywords
- #Content-Based Slides
- #Design-Based Slides
- #Financial Plans and Performance
- #Diagram
- #Budget
- #Key Financial Indicators
- #Table
- #16:9
- #financial data table PowerPoint slide
- #budget visualization presentation
- #financial indicators table slide
- #investment report PPT
- #how to create financial tables in PowerPoint
About the Product
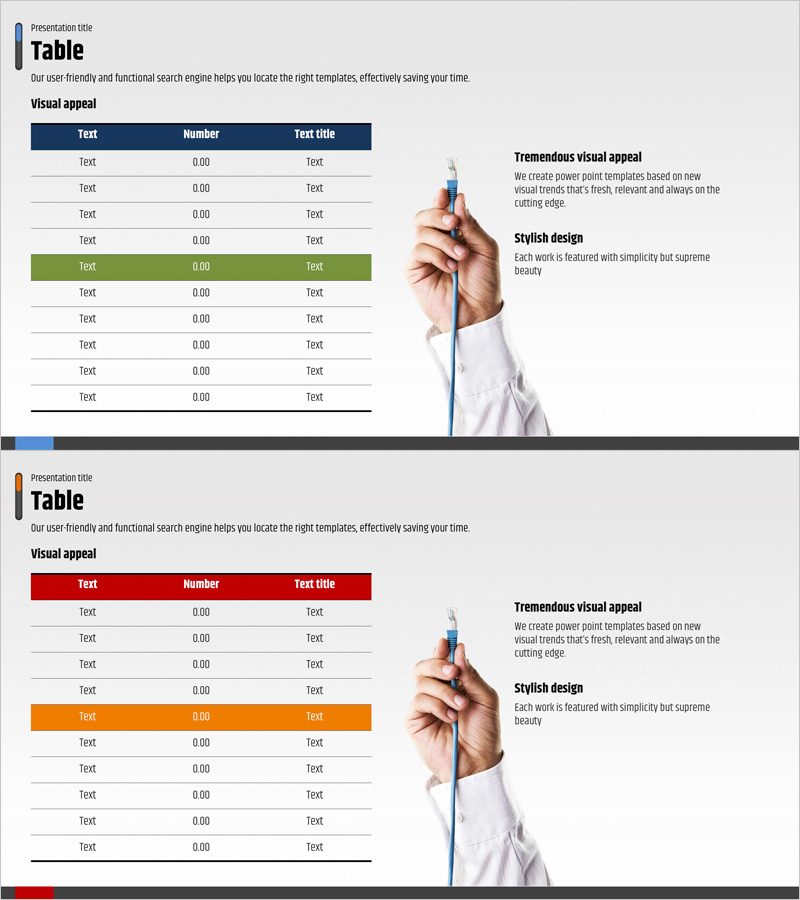
A 2-slide PowerPoint presentation set that clearly visualizes financial indicators and budget data. The first slide features a dark blue header with a 10-row, 3-column table for structured numerical data, complemented by a hand image and text area on the right. The second slide uses the same layout with a red header and orange highlight row to distinguish key items. Both slides include a left color bar and top title section, optimized for 16:9 widescreen format. Perfect for investor presentations, financial reports, budget review meetings, and executive dashboards requiring data-driven decision support.
Usage Points
-
Main Usage
Presents financial metrics, budget status, ROI, balance sheets, and other numerical data in a structured table format, enhancing financial readability and clearly demonstrating decision-making rationale.
-
How to Use
Use in investor relations materials, financial reports, budget review meetings, and executive presentations to summarize key financial figures. Edit row text and numbers to input actual data for immediate deployment.
-
Recommended For
CFOs, finance managers, investment officers, and executives explaining financial performance to employees, investors, and partners. Ideal for quarterly and annual financial reviews, budget approval meetings, and investment pitch presentations.
-
Slide Structure
Each slide contains a top title section, center 10-row 3-column table (1 header row + 9 data rows), and right-side image and text area. First slide uses dark blue header; second uses red header with orange highlight row to express information hierarchy.
Related Products
-

Modern Business Plan Presentation Template Text Diagram – Financial Performance and Budget Management
#Financial Plans and Performance #Diagram #Budget
-

Agricultural Budget Table – Harmony of Green and Purple
#Financial Plans and Performance #Diagram #Budget
-

Aurora Camping Business Key Financial Indicator Table
#Financial Plans and Performance #Diagram #Budget
-

Camping Business Financial Planning Table – Budget and Key Metrics
#Financial Plans and Performance #Diagram #Budget
