Financial Indicators and Profit and Loss Statements Slide – Visualized in Blue and Green
RJ0400003_12
- Last Update 05/17/2025
- File Size 3.9MB
- # of Slides 2
- File Format PPTX
- Slide Ratio 16:9
- Color
Keywords
- #Content-Based Slides
- #Design-Based Slides
- #Financial Plans and Performance
- #Diagram
- #Income Statement
- #Key Financial Indicators
- #Table
- #Standard Table
- #16:9
- #financial data table PowerPoint
- #P&L statement slide
- #financial metrics presentation template
- #financial reporting slide design
- #profit and loss visualization
About the Product
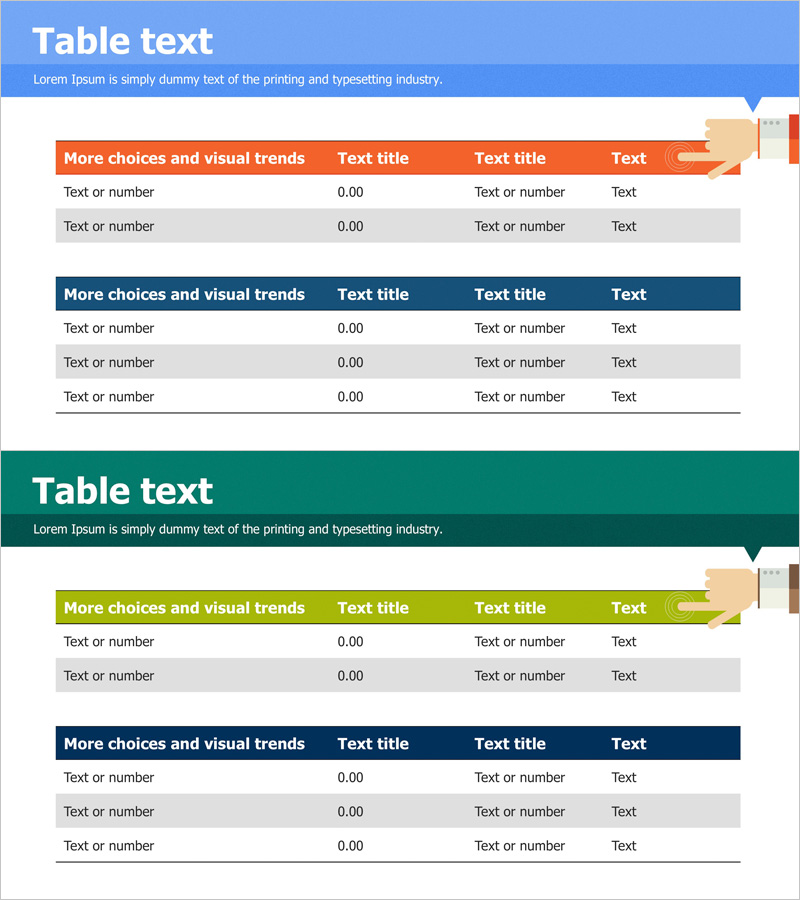
A PowerPoint slide featuring a 4-column table structure designed to present financial data and profit-and-loss statements clearly. Two tables with blue and green header rows organize financial metrics and P&L information side by side. Alternating row colors (white and gray) enhance readability and allow viewers to compare numerical data and line items at a glance. Ideal for quarterly earnings presentations, investor relations meetings, and financial reports where complex financial information must be communicated intuitively. 2 slides / 16:9 aspect ratio / PPTX format.
Usage Points
-
Main Usage
Present profit-and-loss statements and financial metrics in quarterly earnings calls, investor presentations, and financial reports. The 4-column layout displays line items, figures, and comparative data simultaneously, communicating financial performance with clarity.
-
How to Use
Click the table headers (blue and green) to edit line item names. Enter numerical data in the rows below. Row background colors (white and gray) alternate automatically for improved readability. Duplicate existing rows to add more data entries as needed.
-
Recommended For
CFOs, finance managers, executives, and investor relations professionals presenting quarterly results, annual financial statements, and P&L analysis. Suitable for financial institutions, public companies, and startup pitch decks.
-
Slide Structure
Slide 1: Blue-header table (4 columns × 3 rows) and green-header table (4 columns × 3 rows). Each table includes a colored header row and alternating white/gray data rows. Decorative arrow element in upper right corner for visual emphasis.
Related Products
-

Key Financial Indicators Table – Trust and Professionalism
#Financial Plans and Performance #Diagram #Income Statement
-

Space Illustration Theme Chart – Income Statement and Key Financial Metrics
#Financial Plans and Performance #Diagram #Income Statement
-

Table Slide Visualizing Financial Performance with DNA Theme
#Financial Plans and Performance #Diagram #Income Statement
-

Income Statement Table – Clearly Presenting Financial Plans and Performance
#Financial Plans and Performance #Diagram #Income Statement
