Financial Indicators and Income Statements – Current Trends and Statistics
RJ0400004_14
- Last Update 05/18/2025
- File Size 2.4MB
- # of Slides 2
- File Format PPTX
- Slide Ratio 16:9
- Color
Keywords
- #Content-Based Slides
- #Design-Based Slides
- #Financial Plans and Performance
- #Diagram
- #Income Statement
- #Key Financial Indicators
- #Table
- #Standard Table
- #16:9
- #financial data table PowerPoint
- #income statement slide template
- #financial metrics comparison chart
- #financial report presentation
- #table chart PowerPoint slide design
About the Product
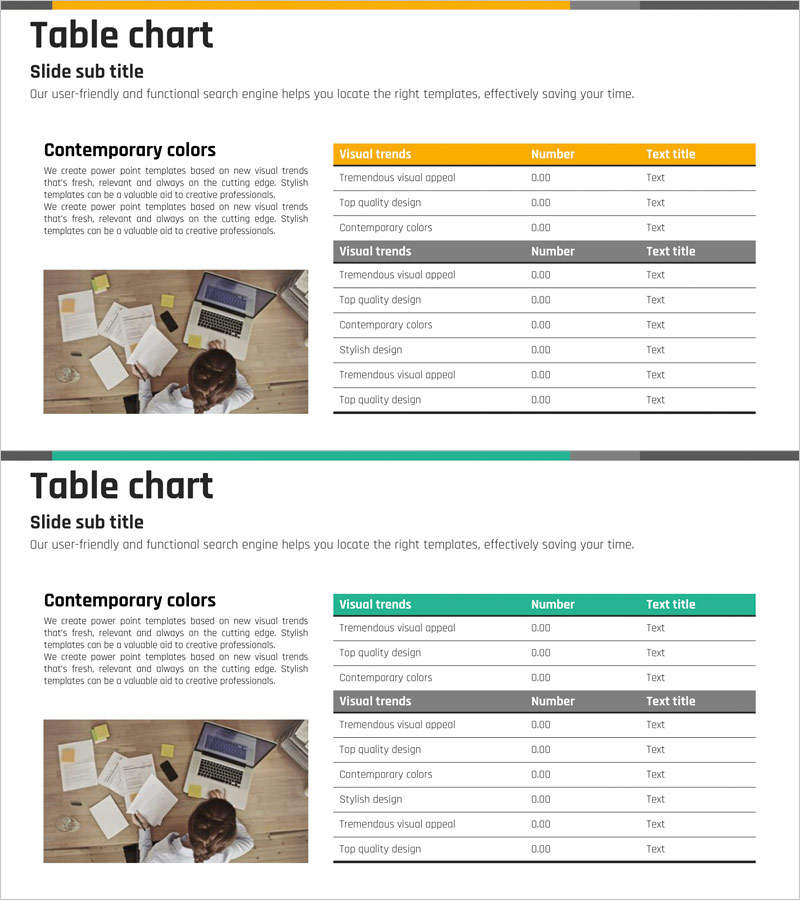
A table-based PowerPoint slide that clearly organizes financial metrics and income statement data. The design features a yellow header and gray divider lines to create visual hierarchy, with a 3-row comparison structure for effective data presentation. The 2-slide set is optimized for 16:9 widescreen format and enables side-by-side comparison of financial indicators. Perfect for business presentations including financial reports, business plans, investor pitches, and quarterly earnings reviews. Fully editable and ready to use immediately in your presentation.
Usage Points
-
Main Usage
Present financial metrics, income statements, and revenue data in a structured table format to executives, investors, and stakeholders. The yellow header emphasizes key items while gray divider lines organize information hierarchy for improved readability and professional appearance.
-
How to Use
Insert into financial reports, business plans, investor presentations (IR), and financial analysis decks in the financial metrics section. Enter financial line items (revenue, expenses, profit, etc.) and corresponding figures into each row. Colors and fonts are fully editable to match your corporate branding.
-
Recommended For
CFOs, finance managers, and executives presenting financial performance to investors, banks, government agencies, and other stakeholders. Essential for startup fundraising pitches, M&A presentations, annual financial reports, and quarterly earnings reviews.
-
Slide Structure
2-slide set with consistent table layout. Each slide features a header row (yellow on slide 1, gray on slide 2) with three columns: Visual trends, Number, and Text title. Three data rows below enable comparison of multiple financial metrics across different categories or time periods.
Related Products
-

Income Statement Table – Clearly Presenting Financial Plans and Performance
#Financial Plans and Performance #Diagram #Income Statement
-

Business Income Statement – Visualizing Financial Performance
#Financial Plans and Performance #Diagram #Income Statement
-

Income Statement Table – Clearly Presenting Financial Plans and Performance
#Financial Plans and Performance #Diagram #Income Statement
-

Innovative Chart Slide Featuring AI Theme
#Financial Plans and Performance #Diagram #Income Statement
