Visualizing Key Financial Indicators with Diagram Presentation
RJ0400050_23
- Last Update 05/31/2025
- File Size 2MB
- # of Slides 2
- File Format PPTX
- Slide Ratio 16:9
- Color
Keywords
- #Content-Based Slides
- #Design-Based Slides
- #Financial Plans and Performance
- #Diagram
- #Sales and Revenue
- #Key Financial Indicators
- #Table
- #Standard Table
- #16:9
- #financial metrics table PowerPoint
- #financial comparison chart slide
- #performance analysis diagram
- #financial data visualization PPT
- #table-based presentation slide template
About the Product
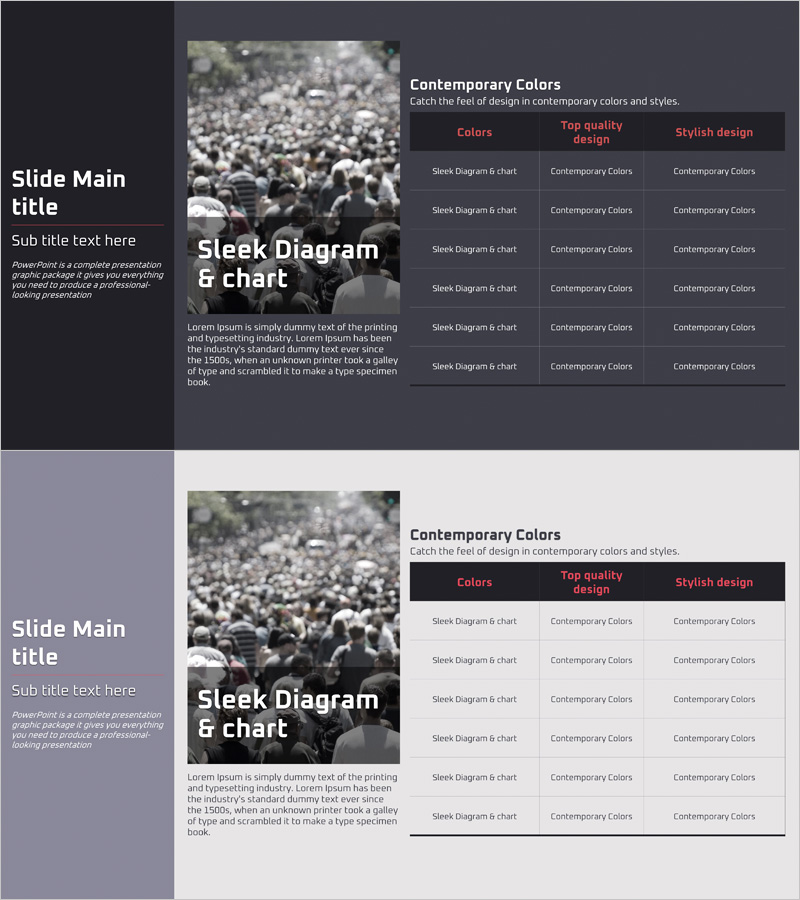
A table-based diagram PowerPoint slide for systematically organizing financial performance data. Featuring a dark background with white text and red accent colors for high contrast, this slide clearly compares key financial indicators in a row-and-column structure. The 2-slide set enables visualization of various financial data items in table format, ready for immediate use in presentations, reports, and performance analysis materials. Compatible with all presentation environments in 16:9 widescreen PPTX format.
Usage Points
-
Main Usage
Optimized for systematically arranging and comparing financial performance, indicators, and numerical data in table format. The dark background with high-contrast design maximizes readability of numerical information, providing credibility for executive reports, investor presentations, and internal performance analysis materials.
-
How to Use
Place in the financial section of quarterly reports, performance presentations, and investor pitch decks to present key metrics (revenue, profit, growth rate, etc.) in table format. Enter numerical values in each cell and add color highlights as needed to emphasize critical items.
-
Recommended For
CFOs, finance managers, executives, and IR teams presenting quantitative financial performance. Ideal for business plans, quarterly reports, annual results presentations, investor meetings, and internal management reviews requiring data-driven decision-making.
-
Slide Structure
2-slide set with each slide featuring a table structure of 6 columns and multiple rows. Header row displays item names in red background with white text, while data rows present numerical values in dark background with light text. 16:9 widescreen ratio provides sufficient column width for clear representation of complex financial data.
Related Products
-

Cost Table by Beans – Unique Financial Analysis
#Financial Plans and Performance #Diagram #Sales and Revenue
-

Blue Line Wide Template Table1
#Financial Plans and Performance #Diagram #Sales and Revenue
-

Farm Key Financial Indicators Table Chart – Intuitive Presentation of Financial Performance
#Financial Plans and Performance #Diagram #Sales and Revenue
-

Colors Theme Presentation Template Table – Financial Planning and Performance
#Financial Plans and Performance #Diagram #Sales and Revenue
