Vibrant Paint Splash Table Slide – Financial Performance at a Glance
RJ0200040_29
- Last Update 04/09/2025
- File Size 3.7MB
- # of Slides 2
- File Format PPTX
- Slide Ratio 16:9
- Color
Keywords
About the Product
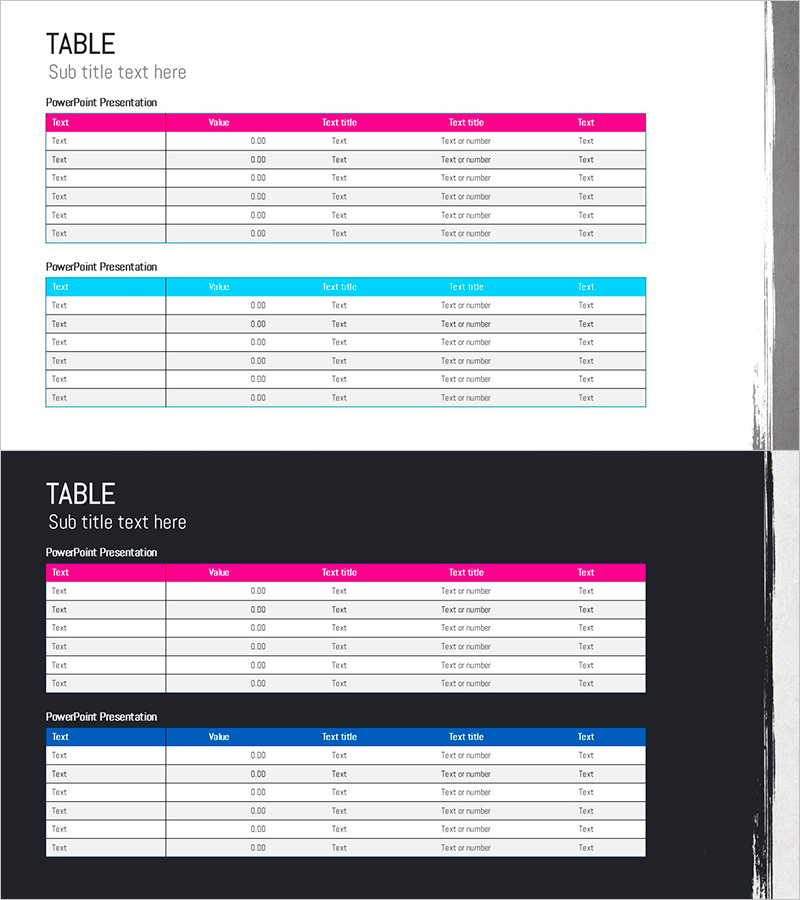
A 2-slide table template set designed to present financial performance and business metrics with clarity. The pink and cyan dual-tone header emphasizes data categorization, while the 5-column structure (Item, Value, Text Title, Text Title, Text) accommodates income statements, cash flow reports, sales summaries, and other financial data. Each PowerPoint slide provides 6 data entry rows with a light background and clear dividing lines for optimal readability. This presentation template is ready to use in executive reports, financial analyses, and business performance reviews.
Usage Points
-
Main Usage
Present quantitative data such as financial performance, sales figures, and business metrics in a structured table format. Ideal for income statements, cash flow analysis, quarterly results, departmental performance, and comparative financial data in executive presentations.
-
How to Use
Enter numerical values and text directly into the table cells. The pink and cyan headers distinguish data categories, while the 6 data rows accommodate item-by-item information. Background colors and line styles can remain as designed or be customized to match your corporate branding.
-
Recommended For
Finance teams, executives, business managers, consultants, and analysts presenting in board meetings, investor presentations, quarterly earnings reports, and business proposals. Particularly suited for data-driven decision-making presentations in corporate environments.
-
Slide Structure
2-slide set with each slide containing 5 columns (Item, Value, Text Title, Text Title, Text) and 6 data entry rows. Headers feature pink and cyan dual-tone design with light background and clear gridlines for enhanced data visibility.
Related Products
-

Activity Time & Calorie Burn Table – Structure for Financial Performance
#Financial Plans and Performance #Diagram #Income Statement
-

Green Blue Standard Table – Visualizing Financial Plans
#Financial Plans and Performance #Diagram #Income Statement
-

Network Development Budget and Profit and Loss Statement – Financial Planning Visualization
#Financial Plans and Performance #Diagram #Income Statement
-

Learning Illustrations and Table Charts – Visualizing Financial Performance
#Financial Plans and Performance #Diagram #Income Statement
